
It’s no secret that here at New Constructs we love the financial footnotes and Management’s Discussion and Analysis (“MD&A”). Tucked before and after the financial statements, these often-unread notes can be hundreds of pages of boring accounting jargon and legalese, but they contain important information on items such as non-recurring expenses, off balance sheet arrangements, and pension obligations.
For most companies, Note 1 to the consolidated financial statements will be titled “Summary of Significant Accounting Policies” or some variant thereof. It’s an innocuous title, but this footnote contains a wealth of important information about how all the headline numbers in the financial statements are actually calculated. If you want to understand the underlying economics of the company’s business, you have to understand its accounting policies.
Buried in the footnotes and MD&A, you can find where reported expenses understate true costs, red flags for earnings manipulation and significant differences that need to be reconciled when comparing companies.
Reported Expenses Understate True Costs: Netflix (NFLX)
We’ve written about Netflix’s (NFLX) content costs a few times in the past. It’s no secret that we think the streaming video company’s rising costs to license its content will make it almost impossible for the stock to live up to its lofty valuation. What many investors don’t realize, however, is that NFLX’s accounting policies actually understate the real cash expense of building its content library.
For its streaming content, Netflix follows Accounting Standards Codification (ASC) 920, which determines how broadcasters should account for the licensing of films, TV shows, and other video rights. Essentially, the standard requires that companies create an asset and a liability when they buy the rights to a show or movie from a third party, and then amortize the asset over the life of the license. The amortization is what gets recorded as an expense on the income statement, rather than the actual amount paid for the license.
Figure 1 shows the difference between the cash Netflix has paid to add to its streaming content library in each year and the expense recognized for the amortization of streaming content and changes to streaming content liabilities.
Figure 1: Reported Content Costs Vs. Actual Cash Paid For New Content
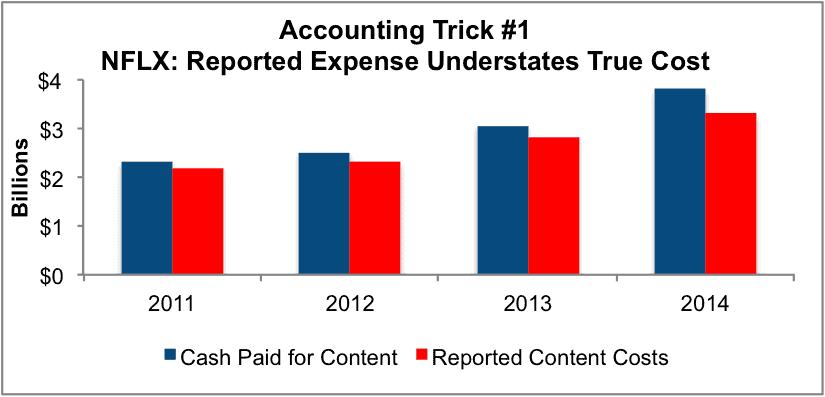
Sources: New Constructs, LLC and company filings.
Key points from Figure 1:
- In just four years, the difference between reported content costs and the actual cash payments for new content is nearly $1 billion.
- In 2014 alone Netflix paid $500 million more to add to its library than it recognized in expenses.
- These differences represented about 10% of expenses and would have reduced EPS from $4.32 to -$1.31 in 2014
As long as NFLX continues to increase the size of its content library, which it will likely do for many years as it expands internationally, reported streaming content expense will continue to lag significantly behind the actual cash payments for streaming content.
This large discrepancy in real versus reported costs gets to a deeper issue: the accounting standard that NFLX uses was written in 1982, long before anyone had considered the possibility of an on-demand internet streaming service. Back in 1982, there were only three main broadcasters along with a handful of cable networks that weren’t available in most homes. The fact that Netflix in 2015 uses the same accounting treatment for its content as CBS in the early 1980’s seems somewhat odd.
For instance, amortization of content costs is supposed to roughly line up with the flow of revenue from the license, so that reported revenue and costs in each period will reflect the underlying economics of the contract. Accurately amortizing costs requires a company to be able to project the revenue generated by a license. How can Netflix, which doesn’t earn revenue from each individual stream but instead from subscriptions, accurately project how any particular show or movie license will contribute to revenue?
For now, the company amortizes its licenses for third party content on a straight-line basis, which means it records the same expense in each quarter over the life of the license. This approach is how networks have traditionally accounted for the rights to syndicated shows (reruns).
However, there are some major questions as to whether this approach accurately represents the economics of the deal. Do third-party shows on Netflix really generate the same amount of revenue in their fourth year as in their first? When Friends came to Netflix January 1 of this year, the internet was full of people talking about their plans to binge watch the show. It’s hard to imagine that Friends will be creating similar value for Netflix in 2018.
Netflix’s content cost reporting is just one of many cases where accounting standards have not completely kept up with changing business practices. NFLX is not doing anything illegal; it’s accounting for content costs using the most relevant applicable standard. Only by digging deeper into accounting standards and policies can investors figure out if they’re really getting the most accurate portrayal of a company’s profits.
Red Flag For Earnings Manipulation: M/A-Com (MTSI)
Changes to significant accounting policies can be a red flag for future earnings manipulation. We profiled one such example in June when our research on chipmaker M/A-Com (MTSI) was featured in Barron’s. Back in January, MTSI switched from a “sell-through” to a “sell-in” method of revenue recognition, which means it now recognizes revenue when products are sold to distributors rather than when those distributors sell the products on to the end customers.
The problem with the sell-in method is that MTSI’s distributors have the right to return product for a full refund if it goes unsold and get rebates if the price of the product drops. The company claims that it has enough data to reasonably predict and reserve for the cost of future returns. However, if it gets this calculation wrong, it could end up significantly overstating revenue and facing major return liabilities.
In addition, the sell-in method opens up the potential for deliberate earnings manipulation. Channel stuffing is an extremely common form of earnings manipulation. Channel stuffing occurs when companies sell excess inventory to distributors, knowing that the distributors will turn around and return it in the next quarter. This tactic can make the difference between whether or not a company hits revenue and earnings targets for a quarter.
What’s worse, channel stuffing doesn’t need to be a company-wide policy. If salespeople within the company have to hit quarterly or monthly quotas, they might engage in channel stuffing on their own accord in order to hit their targets and earn bigger commissions. The company can wind up misleading investors without management even realizing what’s going on.
MTSI is not the only company that has made the switch from sell-through to sell-in in recent years. Our research also found four other companies—Alkermes (ALKS), Halozyme Therapeutics (HALO), Insys Therapeutics (INSY), and OraSure Technologies (OSUR)—that have made a similar change since 2012.
The biggest problem with sell-in is that it decreases transparency. Companies don’t have to account for inventory in distributor channels, which means they have more leeway to manipulate earnings without investors noticing. Whenever a company discloses a significant change to its accounting policies that decreases transparency, investors should take notice. With CFO’s themselves saying that 20% of companies manipulate earnings, anything that makes manipulation easier is a red flag for investors.
Different Policies Impact Comparability: Clayton Williams Energy (CWEI) and Triangle Petroleum (TPLM)
Investment decisions on specific stocks should not to be made in a vacuum. You’re not just trying to determine how profitable a company is, you want to get a sense of how it stacks up against its competitors. Unfortunately, investors that don’t adjust for different accounting policies are always going to get a misleading result when they try to compare multiple companies.
For instance, anyone trying to compare oil and gas exploration companies needs to consider the impact different accounting policies can have on financial results. E&P companies can choose to account for exploration costs with either the successful efforts or full cost method of accounting. Successful efforts immediately expenses the cost of unsuccessful drilling efforts (or dry hole costs), while full cost accounting mandates that all costs related to locating new reserves be immediately capitalized.
This confusion dates back to conflict between the Financial Accounting Standards Board (FASB) and the SEC in the 1970’s. FASB wanted to mandate successful efforts, the SEC wanted to allow both options. Eventually, FASB relented, and for the past several decades companies have had the option to choose between these two different methods.
This accounting optionality creates a massive issue for investors, as companies that use successful efforts will report less capital invested in their business, which enables them to boost ROE, ROA, RONA and even unadjusted return on invested capital (ROIC) in the future. We favor the full cost method of accounting and convert all companies that use successful effort to full cost to ensure our ROICs and other measures of corporate performance are always apples-to-apples. We think the full cost method is superior because E&P companies should be held accountable for all the capital they invest in drilling operations, not just those that end up producing new reserves. We count dry hole costs as write-downs and add them back to invested capital.
Figure 2 shows how significant the impact of using the successful efforts method can be. Over the past decade, CWEI has managed to keep nearly $400 million in capital expenditure off of its balance sheet by recording it as a dry hole expense instead of a write-down.
Figure 2: CWEI Reports Fewer Write-Downs Using Successful Efforts
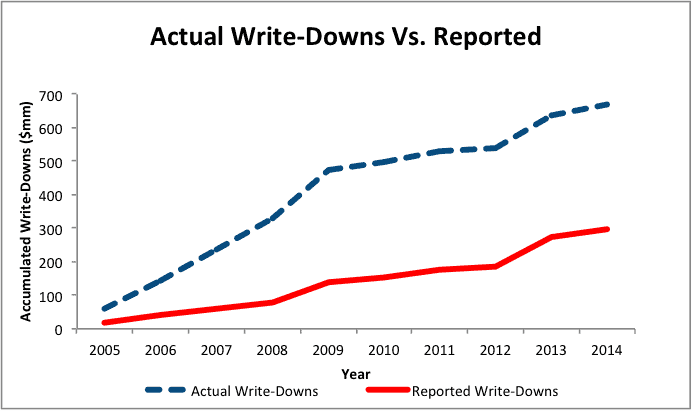
Sources: New Constructs, LLC and company filings.
The divergence between reported versus actual write-downs makes a big difference when analyzing different companies. If we don’t factor in that $400 of invested capital, CWEI would have appeared to earn an ROIC of 7% last year rather than its actual return of just 5%. If we didn’t make this adjustment, CWEI would look more profitable than a company like Triangle Petroleum (TPLM), which uses the full cost method and earned an ROIC of 6% last year, when actually it was less profitable.
For fiscal year 2014, we found $20 billion in write-downs for the 72 E&P companies we track. The dry hole cost of just one company, Noble Energy (NBL) accounted for $226 million.
Failing to reconcile conflicting accounting policies means you end up comparing apples and oranges when trying to analyze multiple companies. Accounting rules aren’t sexy, but you have to read through them if you’re going to understand the underlying economics of a business.
Disclosure: David Trainer and Sam McBride receive no compensation to write about any specific stock, sector, style, or theme.
Click here to download a PDF of this report.
Photo Credit: Ken Teegardin (Flickr)
2 replies to "3 Ways Accounting Tricks Can Crash Your Portfolio"
Should we be capitalizing R&D, particularly for drug companies?
Hi John,
Good question. I’ve found that the capitalization of R&D does not add much value.
The impact of the capitalization is predictable:
1. makes unprofitable companies (heavy R&D as % or rev) look more profitable.
2. Make profitable comapnies (light R&D as % of rev) lookless profitable
For companies that are the in drug business and are constantly spending on R&D to create new drugs, there’s not realy a need to capitalize R&D. For those where the R&D is one-off, you can make an argument that capitalizing is helpful. You can also argue the otehr way.
Am I making sense?