
As earnings season rolls on, many large companies are pulling guidance due to an uncertain economic outlook. We don’t really care about guidance. It’s mostly a game for Wall Street insiders to manipulate unsuspecting investors’ expectations. We do care about earnings, however, because they come with new financial filings, which is where we find the insights that drive our proven-superior research. In fact, CEO David Trainer recently hosted an earnings watch party to discuss what the earnings for Tesla (TSLA), General Electric (GE), Verizon (VZ), and many others says about the current market.
We also care about incentives, especially executive compensation incentives. When companies that tie executive compensation plan incentives to return on invested capital (ROIC), we think they are more likely to create shareholder value. Our Exec Comp Aligned with ROIC Model Portfolio only includes companies that have Attractive-or-better ratings and tie executive compensation to ROIC.
We are proud to offer the Exec Comp Aligned with ROIC Model Portfolio, and we are excited to give you a free stock pick from this Model Portfolio.
The goal behind sharing these free features with you is to deliver insight into the uniquely high value-add of our research. We want you to know how hard we work and how we do research, so you know how reliable research looks and how real AI and machine learning work.
We update this Model Portfolio monthly, and April’s Exec Comp Aligned with ROIC Model Portfolio was updated and published for clients on April 16, 2025.
Free Stock Feature for April: Paccar Inc. (PCAR: $93/share)
Paccar has grown revenue and net operating profit after tax (NOPAT) by 6% and 11% compounded annually, respectively, since 2014. The company’s NOPAT margin improved from 7% in 2014 to 11% in 2024 and invested capital turns rose from 2.3 to 2.5 over the same time. Rising NOPAT margins and invested capital turns drive the company’s return on invested capital (ROIC) from 17% in 2014 to 29% in 2024.
Figure 1: Paccar’s Revenue & NOPAT: 2014 – 2024
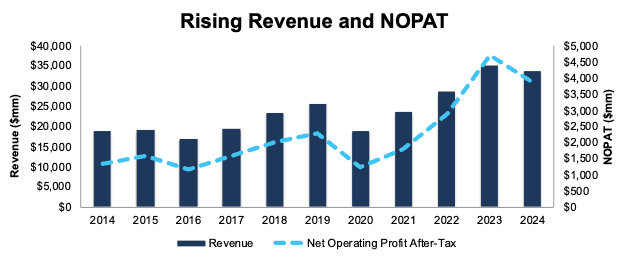
Sources: New Constructs, LLC and company filings
Executive Compensation Properly Aligns Incentives
Paccar’s executive compensation plan aligns the interests of executives and shareholders by tying a portion of its long-term incentive compensation to return on capital (ROC), according to the company’s proxy statement.
The company’s inclusion of ROC, a variation of ROIC, as a performance goal has helped create shareholder value by driving higher ROIC and economic earnings. When we calculate ROIC using our superior fundamental data, we find that Paccar’s ROIC has increased from 17% in 2014 to 29% in 2024. Economic earnings rose from $916 million to $2.8 billion over the same time.
Figure 2: Paccar’s ROIC & Economic Earnings: 2014 – 2024
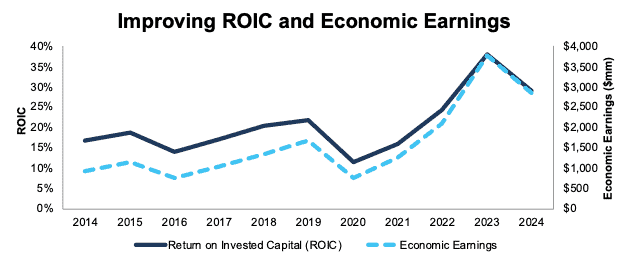
Sources: New Constructs, LLC and company filings
PCAR Has Further Upside
At its current price of $93/share, PCAR has a price-to-economic book value (PEBV) ratio of 0.8. This ratio means the market expects Paccar’s NOPAT to permanently fall 20% from current levels. This expectation seems overly pessimistic for a company that has grown NOPAT 11% and 6% compounded annually since 2014 and 2004, respectively.
Even if Paccar’s
- NOPAT margin falls to 9% (below 10% five-year average and 11% TTM NOPAT margin) and
- revenue grows 4% (below five- and ten-year compound annual revenue growth of 6%) compounded annually through 2034 then,
the stock would be worth $112/share today – a 20% upside. Contact us for the math behind this reverse DCF scenario. In this scenario, Paccar’s NOPAT would grow just 2% compounded annually from 2025 through 2034.
Should the company grow NOPAT more in line with historical growth rates, the stock has even more upside.
Critical Details Found in Financial Filings by Our Robo-Analyst Technology
Below are specifics on the adjustments we made based on Robo-Analyst findings in Paccar’s 10-K:
Income Statement: we made over $700 million in adjustments with a net effect of removing just under $300 million in non-operating income. Professional members can see all adjustments made to Paccar’s income statement on the GAAP Reconciliation tab on the Ratings page on our website.
Balance Sheet: we made just under $11 billion in adjustments to calculate invested capital with a net decrease of over $8 billion. One of the most notable adjustments was for other comprehensive income. Professional members can see all adjustments made to Paccar’s balance sheet on the GAAP Reconciliation tab on the Ratings page on our website.
Valuation: we made over $9 billion in adjustments with a net increase of over $8 billion to shareholder value. The most notable adjustment to shareholder value was excess cash. Professional members can see all adjustments to Paccar’s valuation on the GAAP Reconciliation tab on the Ratings page on our website.
This article was originally published on April 25, 2025.
Disclosure: Hakan Salt owns PCAR. David Trainer, Kyle Guske II, and Hakan Salt receive no compensation to write about any specific stock, style, or theme.
Questions on this report or others? Join our online community and connect with us directly.