
In the world of investing, creating long-term shareholder value is much like cultivating a good garden. Anyone can scatter seeds and hope for the best, just as a company can indiscriminately throw capital at projects or expensive acquisitions. Enduring success demands more than guesswork; it requires discernment, discipline, patience, and a solid process.
Just as a master gardener knows that thriving plants come only from rich, nutrient-dense soil, our Exec Comp Aligned with ROIC Model Portfolio strategy focuses only on companies that tie executive compensation to return on invested capital (ROIC), a measure we’ve long championed as the most objective and reliable indicator of true economic performance and long-term value creation.
By aligning management’s incentives with ROIC, these companies ensure that capital is being allocated with long-term value creation in mind, not short-term optics. This is the financial equivalent of tending to the roots instead of chasing faster blooms. And, much like a garden that yields greater harvests season after season, companies that improve ROIC tend to deliver compounding benefits for shareholders over time.
Our Exec Comp Aligned with ROIC Model Portfolio includes only those stocks that (1) receive an Attractive-or-better rating and (2) directly link executive compensation to ROIC. We believe this combination signals disciplined capital allocation and strong upside potential.
We are proud to offer the Exec Comp Aligned with ROIC Model Portfolio, and we are excited to give you a free stock pick from this Model Portfolio.
The goal behind sharing these free stock picks with you is to deliver insight into the uniquely high value-add of our research. We want you to know how hard we work and how we do research, so you know what you should expect from a good research provider and how real AI works.
We update this Model Portfolio monthly, and June’s Exec Comp Aligned with ROIC Model Portfolio was updated and published for clients on June 13, 2025.
Free Stock Pick for June: Owens Corning (OC: $133/share)
Owens Corning has grown revenue and net operating profit after tax (NOPAT) by 8% and 17% compounded annually since 2014, respectively. The company’s NOPAT margin improved from 6% in 2014 to 14% in the TTM and invested capital turns remained steady at 0.8 over the same time. Rising NOPAT margins drive the company’s return on invested capital (ROIC) from 4% in 2014 to 11% in the TTM.
Figure 1: Owens Corning’s Revenue & NOPAT: 2014 – TTM
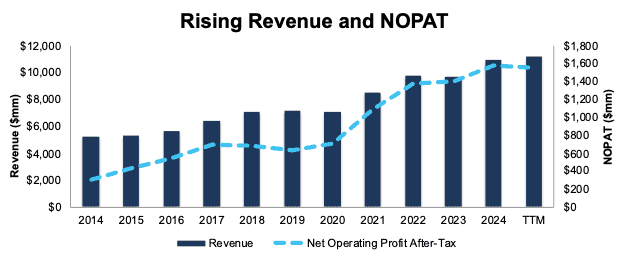
Sources: New Constructs, LLC and company filings
Executive Compensation Properly Aligns Incentives
Owens Corning’s executive compensation plan aligns the interests of executives and shareholders by tying one third of its long-term performance share awards to return on capital (ROC), according to the company’s proxy statement.
The company’s inclusion of ROC, a variation of ROIC, as a performance goal has helped create shareholder value by driving higher ROIC and economic earnings. When we calculate ROIC using our superior fundamental data, we find that Owens Corning’s ROIC has increased from 4% in 2014 to 11% in the TTM. Economic earnings rose from -$104 million to $409 million over the same time.
Figure 2: Owens Corning’s ROIC & Economic Earnings: 2014 – TTM
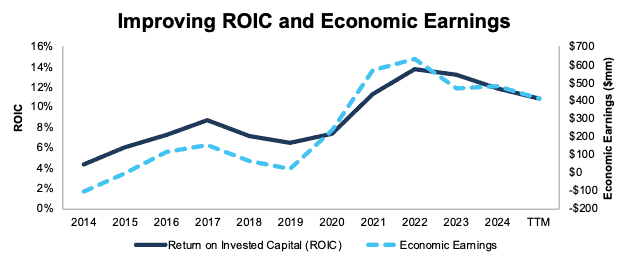
Sources: New Constructs, LLC and company filings
OC Has Further Upside
At its current price of $133/share, OC has a price-to-economic book value (PEBV) ratio of 0.9. This ratio means the market expects Owens Corning’s NOPAT to permanently fall 10% from current levels. This expectation seems overly pessimistic for a company that has grown NOPAT 19% and 17% compounded annually over the last five and ten years, respectively.
Even if Owens Corning’s:
- NOPAT margin falls to 12% (below five-year average of 13% and TTM NOPAT margin of 14%) through 2034, and
- revenue grows just 4% (compared to 9% CAGR over the last five years and 8% CAGR over the last decade) compounded annually through 2034 then,
the stock would be worth $174/share today – a 31% upside. Contact us for the math behind this reverse DCF scenario. In this scenario, Owens Corning’s NOPAT would grow just 2% compounded annually from 2025 through 2034.
Should the company grow NOPAT more in line with historical growth rates, the stock has even more upside.
Critical Details Found in Financial Filings by Our Robo-Analyst Technology
Below are specifics on the adjustments we made based on Robo-Analyst findings in Owens Corning’s 10-K and 10-Qs:
Income Statement: we made under $2 billion in adjustments with a net effect of removing just under $1 billion in non-operating expense. Professional members can see all adjustments made to the company’s income statement on the GAAP Reconciliation tab on the Ratings page on our website.
Balance Sheet: we made just over $5 billion in adjustments to calculate invested capital with a net increase of nearly $600 million. One of the most notable adjustments was for asset write downs. Professional members can see all adjustments made to the company’s balance sheet on the GAAP Reconciliation tab on the Ratings page on our website.
Valuation: we made over $7 billion in adjustments with a net decrease of just under $7 billion to shareholder value. The most notable adjustment to shareholder value was total debt. Professional members can see all adjustments to the company’s valuation on the GAAP Reconciliation tab on the Ratings page on our website.
This article was originally published on June 18, 2025.
Disclosure: David Trainer, Kyle Guske II, and Hakan Salt receive no compensation to write about any specific stock, style, or theme.
Questions on this report or others? Join our online community and connect with us directly.