
In a market where undervalued opportunities are increasingly hard to find, one industry stands out. Homebuilders, largely dismissed amid higher mortgage rates, are trading at valuations that imply a far worse future than the fundamentals suggest.
Not all stocks offer attractive risk/reward just because their industry looks cheap. Investors need to do their diligence on profitability and valuation to find the real winners.
We’ve done the diligence and narrowed in on M/I Homes (MHO: $138/share). The company is taking market share, expanding its operations across the country, delivering more homes, and returning capital through share repurchases. Despite an uncertain housing outlook in the short-term, the long-term drivers, including the ongoing housing shortage, provide years of growth opportunities.
MHO offers favorable Risk/Reward based on:
- persistent undersupply of housing in the U.S.,
- leading market share in its regions,
- ample supply of controlled lots to build on,
- long-term revenue and profit growth, and
- cheap stock valuation.
We Need More Housing
It is no secret that the U.S. needs more houses. While experts debate the exact amount of the shortage, the projected numbers are staggering. For instance, different sources estimate the housing shortage is as high as:
- 4.7 million homes – Zillow July 2025
- 3-4 million homes – Goldman Sachs October 2025
- 4 million homes – Realtor.com December 2025
In fact, JPMorgan Chase, in an October 2025 report, estimates that the current housing shortage could take, conservatively, 10 years to resolve. See Figure 1.
Figure 1: Cumulative Housing Shortage and Trendline
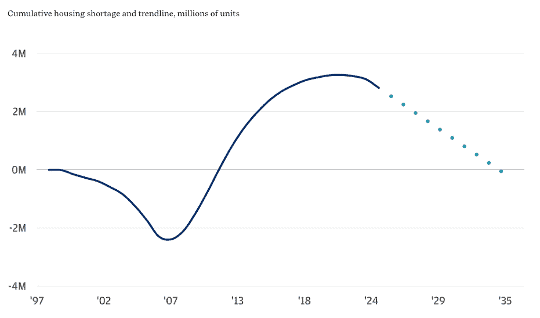
Sources: JPMorgan Chase
Housing Has Rarely Been as Unaffordable
A shortage of houses drives prices higher, which when combined with high interest rates, drives home affordability to some of the lowest levels since mid 2006.
According to The Federal Reserve Bank of Atlanta, the Affordability Index was 69 in October 2025. A value below 100 indicates a median-income family would not be able to afford a median-priced home given the current interest rate. The Affordability Index has been below 100 since May 2021, and matches levels seen in mid 2006.
Enter M/I Homes
As the 13th largest homebuilder in the U.S. based on closings, M/I Homes benefits from demand for its products throughout all economic cycles. After all, everyone needs a place to live.
M/I Homes offers a range of home options, from first-time buyers, move-up buyers, and even empty nesters.
Through a combination of offerings, the company has consistently grown the number of homes it delivers to consumers, while taking market share and generating strong profits.
At the end of 3Q25, M/I Homes operates in 17 markets across 10 states. The company ranks as a top 5 homebuilder in eight of its markets, including Columbus, Ohio (#1), Detroit, MI (#3), Tampa, FL (#3), and Minn/St. Paul, MN (#3). Each of these cities also rank in the top 100 most populous cities in the United States. The company also ranks as a top 10 builder in 13 of its markets.
Taking Market Share
M/I Homes is in strong position even as affordability issues persist. The median sales price of new houses sold in the U.S. sits at ~$413.5k in August 2025, up from ~$332k in February 2020, just before the COVID-19 pandemic sent home prices soaring.
Entry-level homes, which are a large portion of M/I Homes’ business, present a more affordable option for potential homebuyers.
In 3Q25, 52% of M/I Homes’ sales came from M/I Homes’ Smart Series, its most affordable line of homes with an average sales price of $390,000, or 6% below the median sales price across the U.S.
By offering a mix of more affordable homes, as well as “move-up” homes, M/I Homes has successfully captured more of the overall homebuilder market. The company’s share of U.S. new one family homes, based on homes delivered, increased from 0.8% in 2017 to 1.3% in the TTM. See Figure 2.
Figure 2: M/I Homes’ Share of U.S. New One Family Homes Sold: 2017 – TTM
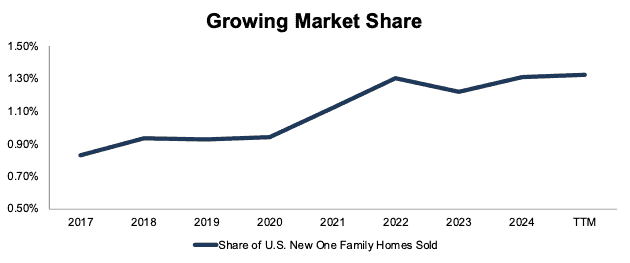
Sources: New Constructs, LLC, company filings, and FRED
5+ Years of Home Lot Supply To Fuel Continued Growth
All homebuilders need land to build communities and sell homes. Land acquisition is, therefore, paramount to any successful homebuilder operation.
M/I Homes’ aims to control a 3-5 year supply of lots through outright ownership or option contracts and purchase agreements. At the end of 3Q25, M/I Homes owned 48% and optioned 52% of its total lots controlled. Between the two, M/I Homes controls 5.6 year’s worth of lots, assuming home closings remain on pace with the TTM period sales.
Growing Sales and Active Communities
With ample lots under control, M/I Homes can focus more on expanding its homes delivered, as noted above, and the number of communities in which it operates across the United States.
M/I Homes has increased its homes delivered from 5,089 in 2017 to 9,022 in the TTM ended 3Q25, or 8% compounded annually. Selling more houses means growing market share. Over the same time, the company’s active communities increased from 188 to 233, per Figure 3. While management avoided specifics on the 3Q25 earnings call, they did note they expect “community count growth next year” as well.
Figure 3: M/I Homes’ Homes Delivered and Active Communities: 2017 – TTM ended 3Q25
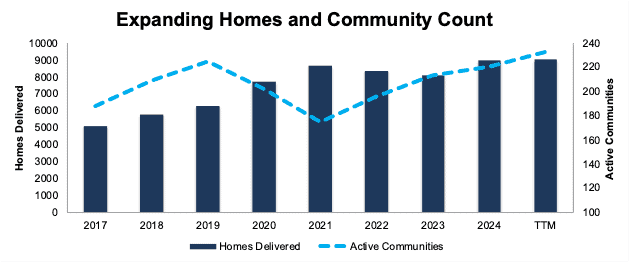
Sources: New Constructs, LLC and company filings
Mortgage Rates Remain a Headwind
Mortgage rates have risen significantly from the record lows of 2021, when the 30-year fixed rate mortgage (FRM) was around 2.2% and the 15-year FRM was around 2.7%.
In January 2026, Freddie Mac estimates that the average 30-year fixed-rate mortgage (FRM) sits at 6.2% and the average 15-year FRM sits at 5.5%. See Figure 4.
Even though mortgage rates have fallen from late 2023 highs (nearly 8% on a 30-year FRM), they remain a headwind for potential homebuyers.
High rates not only increase the cost of buying a new home but also make selling a home bought with a lower interest rate less attractive. M/I Homes’ CEO, Robert Schottenstein, noted on the 3Q25 earnings call that a drop in rates “could help unlock the existing home market” and noted “we’re getting these results really without much help from the sale of existing homes.”
Should existing homeowners look to sell their homes in a lower rate environment, M/I Homes’ move-up options provide an attractive next step in the homeownership life cycle.
Figure 4: 30- and 15-Year Fixed Rate Mortgage: January 2021 – January 2026
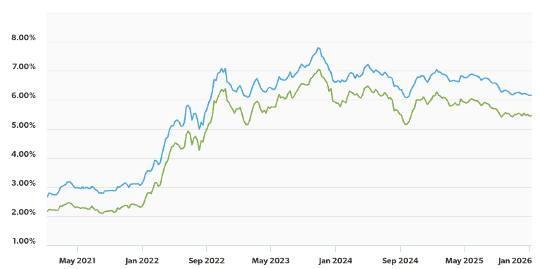

Sources: Freddie Mac
Margin Pressures Persist, but Remain Manageable
The easiest solution to aid consumers and drive demand during times of high interest rates is to provide incentives and rate-buydowns, which create a drag on profitability.
M/I Homes offers rate buydown incentives through its in-house financing operation. Management does not provide the exact amount spent on buydowns but noted in the 3Q25 earnings call they’re currently offering rates in the high 4s to incentivize buyers. These incentives create a strain on margins, and management noted that the “majority” of the margin decline YoY is due to mortgage rate buydowns.
Importantly going forward, M/I Homes’ management believes margins are nearing a bottom. When asked about room for margins to drop in the next few quarters, M/I Homes’ CEO noted “Well, I think we’re a lot closer to the bottom than we were last quarter.”
The good news is that the impact of lower margins (and no subsequent improvement) and any prolonged housing downturn, are already more than priced into MHO at its current price, as we’ll show later in this report.
Institutional Buying Presents a Wildcard
President Trump recently announced intentions to prohibit large institutional investors from buying single family homes. The goal would be to make homes more affordable for families. However, the actual impact of such a policy is less clear, as the data on institutional buying and its effect on affordability is mixed.
An analysis from Realtor.com in October 2025 found that more than “90% of investor-owned homes in the U.S. belong to small landlords with fewer than 11 properties.” The analysis further noted that “even in states with the highest rates of investor ownership, it’s not institutional buyers driving the trend.”
Instead, the best fix for the ongoing affordability challenges across the country come down to supply. As Realtor.com senior economist Jake Krimmel noted to Yahoo Finance, “The affordability crisis is fundamentally a supply problem, and meaningful relief requires adding homes…”
Strong Profit and Revenue Growth
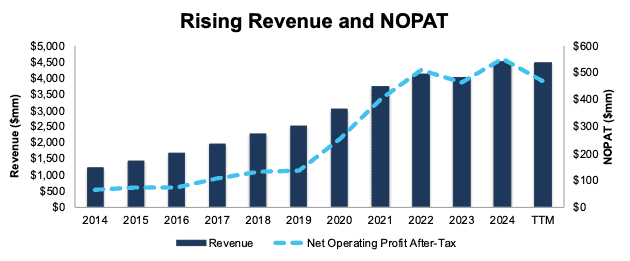
Despite the uncertainty and drag on operations caused by higher rates, M/I Homes has consistently improved its fundamentals over the past decade. The company has grown revenue and net operating profit after-tax (NOPAT) by 13% and 20% compounded annually, respectively, from 2014 through the TTM ended 3Q25. The company’s NOPAT margin improved from 5.2% in 2014 to 10.4% in the TTM, while invested capital turns remained at 1.4 over the same time. Rising NOPAT margins drive M/I Homes’ return on invested capital (ROIC) from 7% in 2014 to 14% in the TTM.
Figure 5: M/I Homes’ Revenue and NOPAT: 2014 – TTM
Sources: New Constructs, LLC and company filings
Profitability Near the Top of the Industry
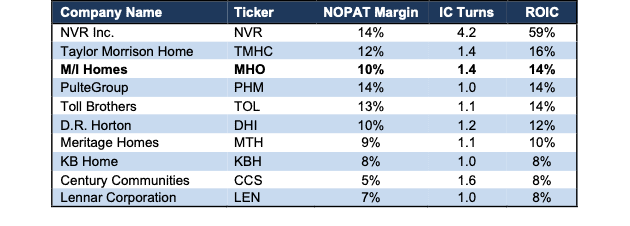
M/I Homes may not be the largest homebuilder, but what it lacks in size it makes up for in profitability. M/I Homes’ ROIC ranks third amongst peers in Figure 6. The companies in Figure 6 are those that rank ahead of M/I Homes in the Builder 100 rankings.
M/I Homes invested capital turns also rank third amongst the competitors in Figure 6, which highlights the company’s balance sheet efficiency. The only companies more profitable, on an ROIC basis, than M/I Homes in Figure 6 are former Long Idea, NVR Inc. (NVR) and Taylor Morrison Home (TMHC), which gets a Neutral Stock Rating.
Figure 6: M/I Homes’ Profitability Vs. Peers: Trailing Twelve Months (TTM)
Sources: New Constructs, LLC and company filings
Potential for 2.7%+ Repurchase Yield
M/I Homes does not pay a dividend but does return capital to shareholders through share repurchases. Since 2020, the company has repurchased over $501 million (14% of market cap) worth of shares.
As of September 2025, the company is authorized to repurchase up to an additional ~$100 million of shares.
Should the company repurchase shares at its TTM rate, it would use up the entirety of its remaining authorization over the next year, which equals 2.7% of the current market cap.
Consistent Cash Flow Generation
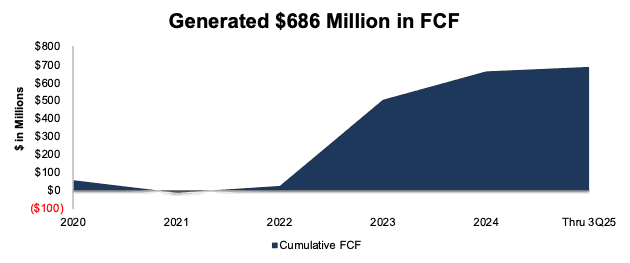
M/I Homes generates the free cash flow (FCF) to continue repurchasing shares too. Since 2020, the company generated $686 million in FCF, which equals 21% of its enterprise value. See Figure 7.
The company generated $117 million in FCF over the TTM.
Figure 7: M/I Homes’ Cumulative Free Cash Flow Since 2020
Sources: New Constructs, LLC and company filings
Reducing Shares Outstanding
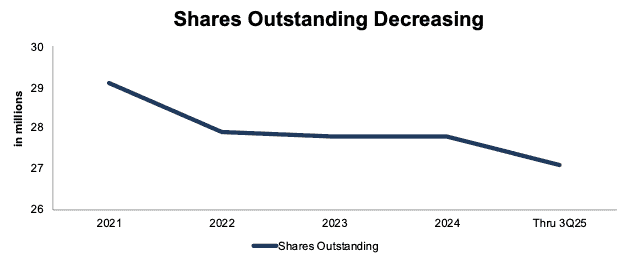
M/I Homes’ aggressive share buyback activity has meaningfully reduced its shares outstanding from 29.1 million in 2021 to 27.1 million in 3Q25. See Figure 8.
We like companies that choose to return capital to shareholders instead of spending it on costly acquisitions or executive bonuses that rarely drive shareholder value creation.
Figure 8: M/I Homes’ Shares Outstanding: 2021 – 3Q25
Sources: New Constructs, LLC and company filings
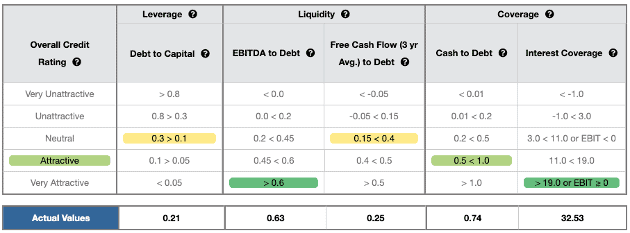
Strong Credit Rating to Withstand Economic Uncertainty
M/I Homes earns an Attractive Credit Rating in part because of its strong EBITDA to Debt and Interest Coverage ratios. M/I Homes earns a Very Attractive rating in each of these two criteria, and an Attractive Cash to Debt ratio. Even if economic conditions deteriorate, the company’s strong financial footing secures its operations for the foreseeable future.
Figure 9: M/I Homes’ Credit Rating Details
Sources: New Constructs, LLC and company filings
Current Price Implies Profits Will Fall
At its current price of $138/share, MHO has a price-to-economic book value (PEBV) ratio of 0.7. This ratio means the market expects the company’s profits to permanently fall 30% from current levels. For context, M/I Homes has grown NOPAT by 24% compounded annually over the last five years and 20% compounded annually over the last ten years. Perhaps even more impressive, the company has grown NOPAT 8% compounded annually over the past two decades.
Below, we use our reverse discounted cash flow (DCF) model to analyze expectations for different stock price scenarios for MHO.
In the first scenario, we quantify the expectations baked into the current price. If we assume:
- NOPAT margin immediately falls to 7% (below ten-year average of 8.1%, five-year average of 11.0% and TTM NOPAT margin of 10.4%) through 2034, and
- revenue falls <1% a year through 2034 (vs. ten-year CAGR of 13% and 5-year CAGR of 11%) then
the stock would be worth $138/share today – equal to the current stock price. In this scenario, M/I Homes’ NOPAT would fall 5% compounded annually from 2024 through 2034. In this scenario, M/I Homes’ NOPAT would equal $315 million in 2034, or 32% below its TTM NOPAT. Contact us for the math behind this reverse DCF scenario.
Shares Could Go 30%+ Higher With No Profit Growth
If we instead assume:
- NOPAT margin immediately falls to 9% (between ten-year average and TTM margin) through 2034,
- revenue grows at consensus rates in 2025 (-3%), 2026 (-6%), and
- revenue grows just 3% each year thereafter through 2034, then
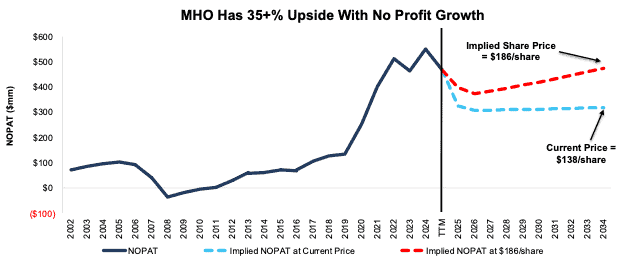
the stock would be worth $186/share today – a 35% upside to the current price. In this scenario, M/I Homes’ NOPAT would fall 2% compounded annually from 2024-2034. In 2034, M/I Homes would generate $473 million NOPAT in 2034, or just 1% more than its TTM NOPAT. Contact us for the math behind this reverse DCF scenario.
Should the company’s NOPAT grow more in line with historical levels, the stock has even more upside.
Figure 10 compares M/I Homes’ historical NOPAT to the NOPAT implied in each of the above scenarios.
Figure 10: M/I Homes’ Historical and Implied NOPAT: DCF Valuation Scenarios
Sources: New Constructs, LLC and company filings
Sustainable Competitive Advantages Will Drive Shareholder Value Creation
Here’s a summary of why we think the moat around M/I Homes’ business will enable it to continue to generate higher NOPAT than the current market valuation implies:
- leading homebuilder in many of the most populous markets,
- proven record of attracting price-sensitive buyers, and
- superior profitability compared to peers.
What Noise Traders Miss with M/I Homes
These days, fewer investors focus on finding quality capital allocators with shareholder-aligned corporate governance. Due to the proliferation of noise traders, the focus is on short-term technical trading trends while more reliable fundamental research is overlooked. Here’s a quick summary of what noise traders are missing:
- persistent undersupply of housing in the United States,
- consistent revenue and NOPAT growth across more than two decades,
- valuation implies profits will permanently decline by 30%.
Lower Rates Could Send Shares Higher
As interest rates reach their lowest levels in over a year, a continued decline in rates would provide a tailwind to profitability, as M/I Homes could limit the use of rate buydowns and further improve margins. Such a scenario could also see shares move higher given that the current expectations baked into the stock price imply a permanent deterioration in margins.
Exec Comp Could Be Improved
M/I Homes’ executives receive annual cash awards and performance stock awards. Annual cash awards are based on adjusted pre-tax income. Performance share awards are based on adjusted pre-tax income and total shareholder return (TSR).
We would prefer the company tie executive compensation to ROIC. Doing so ensures that executives’ interests are more aligned with shareholders’ interests as there is a strong correlation between improving ROIC and increasing shareholder value. Improving ROIC requires attention to all areas of the business, so including it in an executive compensation plan would incentivize executives to improve the entire business, not just the stock performance or one earnings number.
Despite using adjusted pre-tax income and TSR measures, M/I Homes’ management has grown economic earnings, the true cash flows of the business, from $21 million in 2019 to $153 million over the TTM.
Insider Trading and Short Interest Trends
Over the past 12 months, insiders have purchased 93,053 shares and have sold 87,583 shares for a net effect of 5,470 shares purchased. These sales represent <1% of shares outstanding.
There are currently 1.0 million shares sold short, which equates to 4% of shares outstanding and just under five days to cover.
Attractive Funds That Hold MHO
The following funds receive an Attractive-or-better rating and allocate significantly to MHO:
- The Acquirers Fund (ZIG) – 3.3% allocation and Very Attractive rating.
- State Street SPDR S&P Homebuilders ETF (XHB) – 2.2% allocation and Very Attractive rating.
- Invesco S&P Small Cap Consumer Discretionary ETF (PSCD) – 1.8% allocation and Attractive rating.
This article was originally published on January 14, 2026.
Disclosure: David Trainer and Kyle Guske II receive no compensation to write about any specific stock, sector, style, or theme.
Questions on this report or others? Join our online community and connect with us directly.