Our Credit Rating Methodology
More reliable & proprietary fundamental data, proven in The Journal of Financial Economics, drives our Credit Ratings and research, which offer unique insights into the creditworthiness of companies.
We assign one of five Overall Credit Ratings to 2,750+ companies: Very Attractive (best rating), Attractive, Neutral, Unattractive, Very Unattractive (worst rating). We use the same five-point rating system for Equities and ETFs & Mutual Funds.
The Overall Credit Ratings are based on our ratings for five fixed income ratios. We use a 1 to 5 rating scale for each ratio, with 1 as the best (Very Attractive) and 5 as the worst (Very Unattractive). The Overall Credit rating equals the average of the individual ratio ratings rounded to the nearest whole number. The underlying ratios that make up our Credit Ratings are based on data in the trailing twelve month period from a company's latest 10-Q or 10-K.
Figure 1 shows our standard Credit Rating table for Apple Inc. (AAPL). You will find Figure 1 in every one of our Credit Rating Reports.
Figure 1: Credit Ratings Table
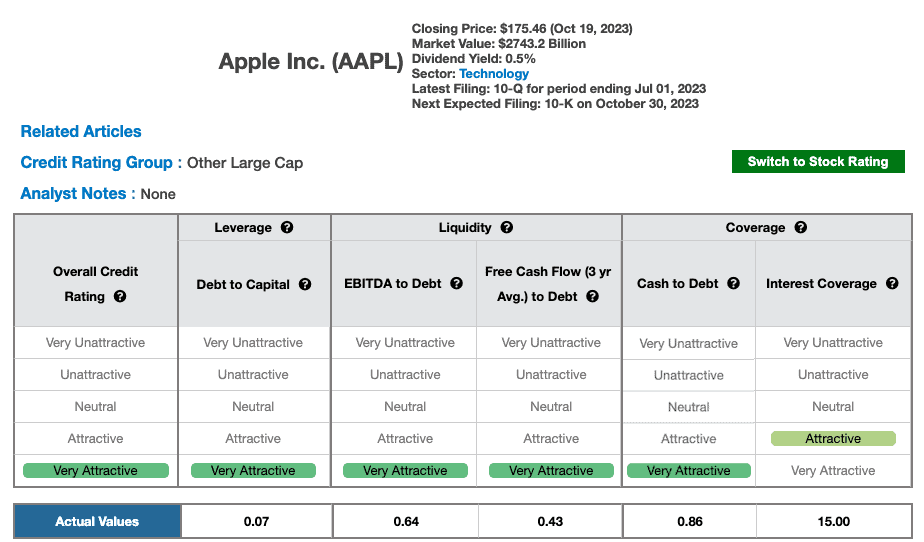
Sources: New Constructs, LLC
Figure 2 shows how our ratings compare to legacy providers.
Figure 2: New Constructs Ratings Compared to Legacy Rating Agencies
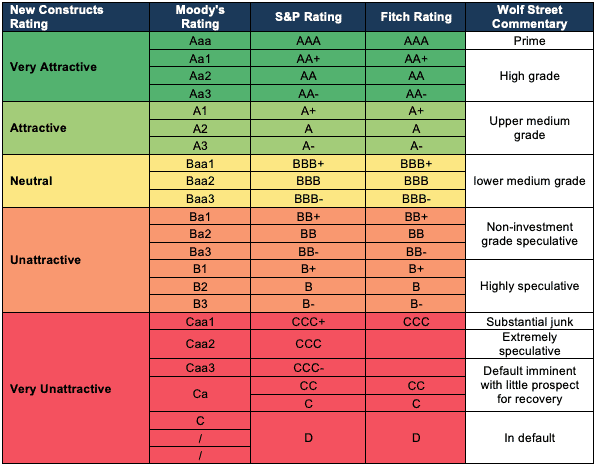
Sources: New Constructs, LLC and WolfStreet.com
In general, our Overall Credit Rating methodology assumes companies are more credit worthy when:
- Leverage is lower as measured by:
- Debt to Capital measures how much debt a company has relative to its Total Capital.
- Liquidity is higher as measured by:
- EBITDA to Debt measures the amount of income available to pay down debt.
- Free Cash Flow (3-yr Avg.) to Debt measures the amount of cash flow a company generates to cover its interest-bearing debt.
- Coverage is higher as measured by:
- Cash to Debt measures how much cash a company has on its balance sheet relative to its debt obligations.
- Interest Coverage measures the company’s ability to meet its interest payments with its current operating profit.
Note that we calculate these ratios using our Adjusted Fundamentals instead of unscrubbed accounting data. Therefore, our credit ratings will often be quite different than ratings from traditional credit rating firms.
How We Determined the Distribution of Credit Ratings
When determining our credit ratings, we aimed to match the general ratings distribution by total debt of the legacy rating agencies. Specifically, we set the thresholds[1] for each ratio to result in a distribution of ratings that closely matches the distribution of ratings by legacy providers based on traditional, unadjusted debt as a percentage of total unadjusted debt. See Figure 3 for details.
Figure 3: Distribution of Ratings for Legacy Rating Agencies

Sources: New Constructs, LLC
It is important to note that we use unscrubbed accounting data in the calculation of the ratios when setting the thresholds.
Our Ratings Are Based on our Superior Data
To provide a more accurate[2] measure of a firm’s creditworthiness, we calculate the ratings for each ratio based on our proprietary adjusted fundamental data. We use our adjusted data because unscrubbed accounting data fails to account for material items hidden in the footnotes of financial filings – as proven by a paper forthcoming in The Journal of Financial Economics.
In other words, we determine the company Credit Ratings based on ratios using adjusted data while the thresholds for scoring each ratio were set based on unadjusted data.
As a result, our credit ratings more accurately reflect a firm’s true fundamentals relative to its true debt load. Our ratings differ from legacy providers' ratings because our adjusted fundamental data drives more insights into earnings and balance sheet strength.
Figure 4: Our Distribution of Ratings Based on Adjusted Fundamental Data – as of 2/16/21

Sources: New Constructs, LLC
Thresholds Differ by Credit Rating Group
This paper compares our analysis on a mega cap company to other major providers.
Want To Learn More?
Sign up to receive free alerts about all our new research reports including Long Ideas and Danger Zone picks.
See our webinar on importance of ROIC and how to calculate it.
Get our report on "ROIC: The Paradigm For Linking Corporate Performance to Valuation."