The reason we focus on Economic Earnings as opposed to Accounting Earnings is because Accounting Earnings are subject to too much manipulation - as Charlie Munger states below. This problem is not going away anytime soon.
We have always known that finding data is the Footnotes is, for most investors who are without our patented Research Platform, like searching for needles in a haystack. With XBRL, the only difference is now investors can search for digital needles in a digital haystack. Funny how little things change.
HIDDEN GEMS:
1. Our discounted cash flow analysis shows that MSFT’s current valuation (stock price of $24.73) implies that the company’s profits will decline by 20% and never grow again.
2. The company has $43,292mm in Excess Cash (over 20% of the market cap), which we remove from our Invested Capital calculation and which helps drive a whopping 61.6% ROIC.
3. Our economic earnings models shows profits are growing, not declining, which makes the Risk/Reward for MSFT Very Attractive.
CBS’s get our Very Dangerous Rating. There is lots of downside risk given the Misleading Earnings and there is little upside reward given the already-rich expectations embedded in the stock price.
RED FLAGS:
1. Misleading Earnings: CBS reported a $11,899mm increase in GAAP earnings while our model shows economic earnings declined by $548mm.
2. Underfunded Pensions of $2,239mm (20% of market value)
3. Asset-write-offs of $10,559mm in asset write-offs (50% of Net Assets and nearly 100% of the market value)
4. High Valuation: market price implies CBS must grow its revenue at 10% compounded annually for 23 years and increase its ROIC from 2.4% to 6% over the same time frame.
icad (ICAD) gets a Dangerous Rating because of these RED FLAGs:
1. Very Expensive valuation: current stock price implies the company will grow revenues at 20% compounded annually for the next 10 years while also improving ROIC from -3.7% to 1.5% within the same time frame.
2. Option Liabilities: of $2.1mm or 3% of the current market value
3. Asset-write-offs: $4.4mm or 7% of Net Assets
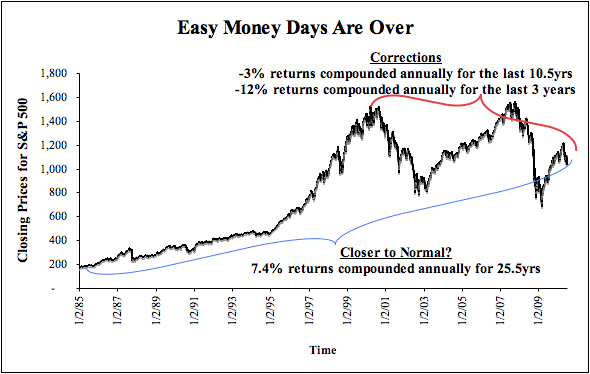
As follow-on to my 3-part Market Outlook series of posts, I am highlighting a quote from GaveKal research's Daily note today which supports my assertion that the "Easy Money Days Are Over" and that success in stock-picking will rely on superior analytical skills as opposed to the market-timing skills that have predominated most of the past 25 years (see Market Outlook Part 1: Rise of the Speculative Movement).
HIDDEN GEM: Our detailed discounted cash flow analysis shows that STX’s current valuation (stock price of $11.24) implies that the company’s profits will decline by 80% and never grow again. Our economic earnings model shows profits are growing, not declining, which makes the Risk/Reward for STX Very Attractive.
The Risk/Reward of investing in Capital One’s stock looks Very Dangerous to me. There is lots of downside risk given the Misleading Earnings and there is little upside reward given the already-rich expectations embedded in the stock price.
RED FLAGS:
1. Misleading Earnings: COF reported a $399mm increase in GAAP earnings while our model shows economic earnings declined by $1,783mm.
2. The company’s ROIC is in the Bottom Quintile of all the companies we cover.
3. Stock price of $40.69 implies COF must grow its NOPAT at 15% compounded annually for 15 years.
Dangerous Rating with several RED FLAGS. See my recent post Mayo Is Right about Citi for details on our analysis of the company's loose Deferred Tax accounting and other Red Flags. There are other reasons to run from this stock.
RED FLAGS:
Over $7bn in off-balance sheet debt
$2.2bn in under-funded Pension liabilities
Over $10bn in Asset write-offs
Very Dangerous valuation (detail follow)
The end of the Speculative Movement and the momentum-investing fad means we are entering an environment more conducive to value investing or, more specifically, an environment where skill in assessing the true economic profitability and valuation of companies will determine the success of stock-pickers.
I believe that most of the traders and speculators who have been successful enough to stay afloat will be forced to exit the business or shift to a value investment style - an endeavor in which I expect very, very few to be successful. And though there will be fewer speculators, enough will remain to keep the markets from being too efficient.
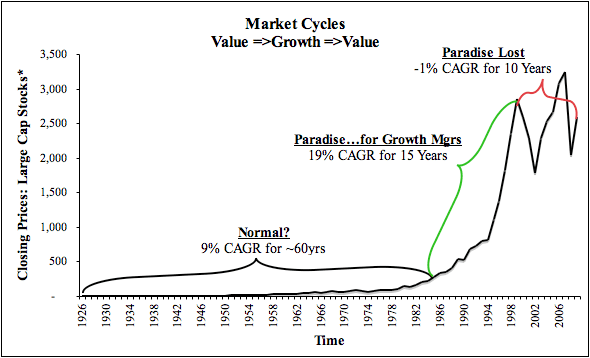
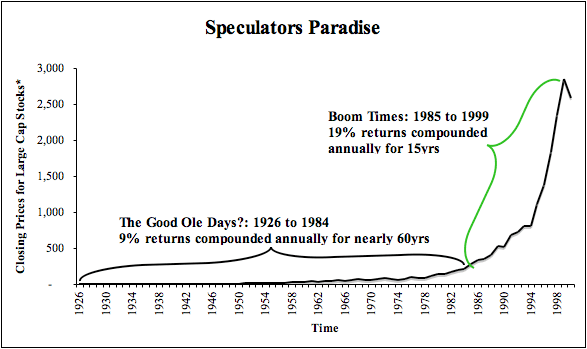
Since the early 1990s, we have seen huge growth in the number of speculators and their impact on the market. Belief that it was easy to make money in the stock market was the primary driver of this boom in speculation. As shown in Exhibit 1, it was VERY easy to make money in the equity markets from 1986 to 1999.
HIDDEN GEM: Our discounted cash flow analysis shows that HPQ’s current valuation (stock price of $38.45) implies that the company’s profits will decline by 20% and never grow again.
A large write-down of its deferred tax assets could be devastating for Citi--over 30% of its total book value is comprised of net deferred tax assets. Our detailed analysis of the Notes to the Financial Statements also found these RED FLAGS :
1. Over $7bn in off-balance sheet debt
2. $2.2bn in under-funded Pension liabilities
3. Over $10bn in Asset write-offs
HIDDEN GEM: Our detailed discounted cash flow analysis shows that MDT's current valuation (stock price of $31.95) implies that the company's profits will decline by 50% and never grow again. Our economic earnings model shows profits are growing, not declining, which makes the Risk/Reward for MDT Very Attractive.
RED FLAG: Our analysis of the Financial Footnotes reveals: the company has written off over $60bn in assets over the last twelve years. That is a big number compared to the company’s market cap of roughly $2.2bn and its net assets of about $1.3bn. This results in economic earnings of -$5,346mm compared to Net Income of -$866mm during the last fiscal year. For details on what causes the difference between Economic Versus Accounting Profits, see Appendix 3 on page 10 of our free report on JDSU.
HIDDEN GEM: Our detailed valuation model shows that MCD grew its “economic” profits more than it accounting profits during its last fiscal year. Economic profits rose by $272mm while accounting profits rose by $238mm. For details on what causes the difference between Economic Versus Accounting Profits, see Appendix 3 on page 10 of our free report on MCD.
RED FLAG: The main driver of the difference between Economic and Accounting earnings is FDX's $11.9bn of off-balance sheet debt, a big number compared to $19.7bn in Net Assets and $25.6bn of market value.
Here is our free report on Sandridge Energy for Ask Matt readers. Our analysis of the Financial Footnotes reveals a major RED FLAG: the company has written off over $3.4bn in assets in just the last two years.