
Sector Analysis 2Q16
The Energy sector ranks last out of the ten sectors as detailed in our 2Q16 Sector Ratings for ETFs and Mutual Funds report. Last quarter, the Energy sector ranked ninth. It gets our Very Dangerous rating, which is based on aggregation of ratings of 22 ETFs and 100 mutual funds in the Energy sector as of April 15, 2016. See a recap of our 1Q16 Sector Ratings here.
Figures 1 and 2 show the five best and worst rated ETFs and mutual funds in the sector. Not all Energy sector ETFs and mutual funds are created the same. The number of holdings varies widely (from 25 to 144). This variation creates drastically different investment implications and, therefore, ratings.
Investors should not buy any Energy ETFs or mutual funds because none get an Attractive-or-better rating. If you must have exposure to this sector, you should buy a basket of Attractive-or-better rated stocks and avoid paying undeserved fund fees. Active management has a long history of not paying off.
Figure 1: ETFs with the Best & Worst Ratings – Top 5
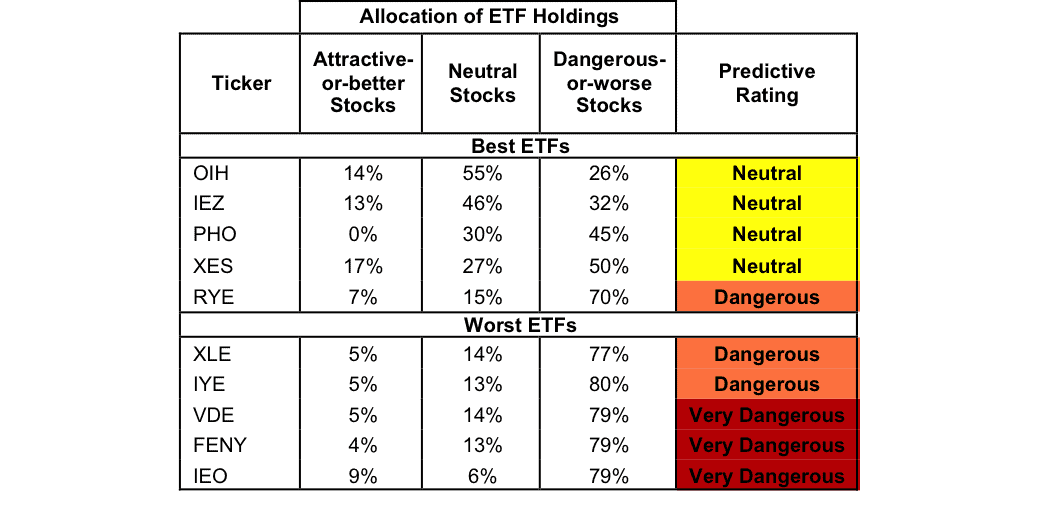
* Best ETFs exclude ETFs with TNAs less than $100 million for inadequate liquidity.
Sources: New Constructs, LLC and company filings
Four ETFs are excluded from Figure 1 because their total net assets (TNA) are below $100 million and do not meet our liquidity minimums. See our ETF screener for more details.
Figure 2: Mutual Funds with the Best & Worst Ratings – Top 5

* Best mutual funds exclude funds with TNAs less than $100 million for inadequate liquidity.
Sources: New Constructs, LLC and company filings
Rydex Series Energy Service Portfolio (RYVIX) is excluded from Figure 2 because its total net assets (TNA) are below $100 million and do not meet our liquidity minimums.
Market Vectors Oil Services ETF (OIH) is the top-rated Energy ETF and MainStay Cushing Renaissance Advantage Fund (CRZZX) is the top-rated Energy mutual fund. Both earn a Neutral rating.
iShares US Oil & Gas Exploration & Production ETF (IEO) is the worst rated Energy ETF and Saratoga Advantage Energy and Basic Materials Portfolio (SBMBX) is the worst rated Energy mutual fund. Both earn a Very Dangerous rating.
178 stocks of the 3000+ we cover are classified as Energy stocks.
LyondellBasell Industries (LYB: $88/share) is one of our favorite stocks held by CRZZX and earns a Very Attractive rating. Over the past five years, LYB has grown after-tax profit (NOPAT) by 10% compounded annually. Over the same time period, Lyondell’s return on invested capital (ROIC) has improved from 17% to a top-quintile 22%. Additionally, over the past four years, LYB has generated a cumulative $14.8 billion in free cash flow. Despite the strength of the business, LYB is undervalued. At its current price of $88/share, LYB has a price-to-economic book value (PEBV) ratio of 0.8. This ratio means that the market expects LYB’s NOPAT to permanently decline by 20% from current levels. If LYB can grow NOPAT by just 4% compounded annually for the next decade, the stock is worth $139/share today – a 58% upside.
Hess Corporation (HES: $57/share) is one of our least favorite stocks held by IEO and earns a Dangerous rating. Contrary to GAAP net income, which has fluctuated wildly over the past decade, Hess’ NOPAT has only worsened by declining from $1.7 billion in 2005 to -$859 million in 2015. Over the same time period, Hess’ ROIC has fallen from 11% to -2%. In a large disconnect from reality, HES has risen over 50% over the past three months, which has made shares more overvalued. In order to justify its current price of $57/share, Hess must immediately achieve positive pre-tax margins (from -22% in 2015) and grow revenue by 20% compounded annually for the next 20 years. In this scenario, 20 years from now Hess would be generating $254 billion in revenue, which would nearly equal oil giant Exxon’s 2015 revenue. The expectations already embedded in HES are unrealistically high.
Figures 3 and 4 show the rating landscape of all Energy ETFs and mutual funds.
Figure 3: Separating the Best ETFs From the Worst ETFs
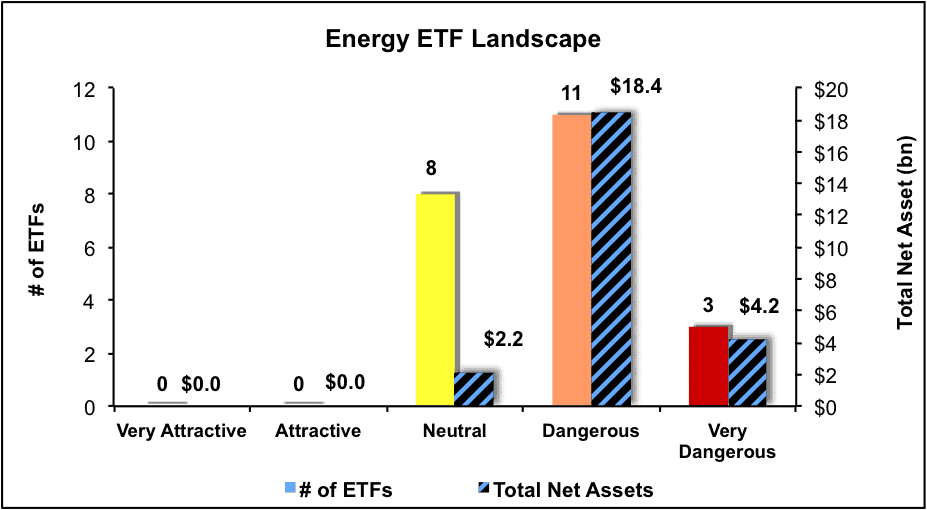
Sources: New Constructs, LLC and company filings
Figure 4: Separating the Best Mutual Funds From the Worst Mutual Funds
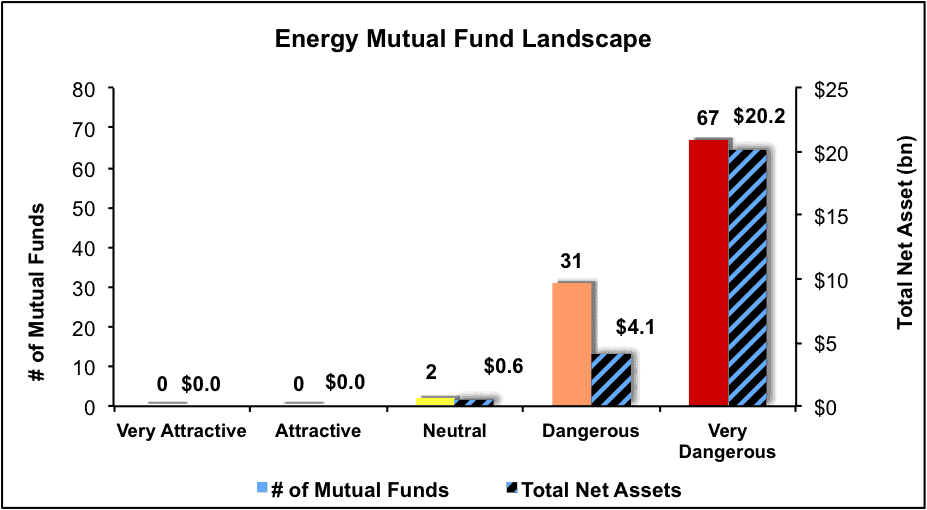
Sources: New Constructs, LLC and company filings
Disclosure: David Trainer and Kyle Guske II receive no compensation to write about any specific stock, sector or theme.
Click here to download a PDF of this report.
Photo Credit: Ryan Lackey (Flickr)