
Sector Analysis 3Q16
The Energy sector ranks ninth out of the ten sectors as detailed in our 3Q16 Sector Ratings for ETFs and Mutual Funds report. Last quarter, the Energy sector ranked last. It gets our Dangerous rating, which is based on an aggregation of ratings of 22 ETFs and 114 mutual funds in the Energy sector as of July 12, 2016. See a recap of our 2Q16 Sector Ratings here.
Figures 1 and 2 show the five best and worst rated ETFs and mutual funds in the sector. Not all Energy sector ETFs and mutual funds are created the same. The number of holdings varies widely (from 25 to 146). This variation creates drastically different investment implications and, therefore, ratings.
Investors should not buy any Energy ETFs or mutual funds because none get an Attractive-or-better rating. If you must have exposure to this sector, you should buy a basket of Attractive-or-better rated stocks and avoid paying undeserved fund fees. Active management has a long history of not paying off.
Figure 1: ETFs with the Best & Worst Ratings – Top 5
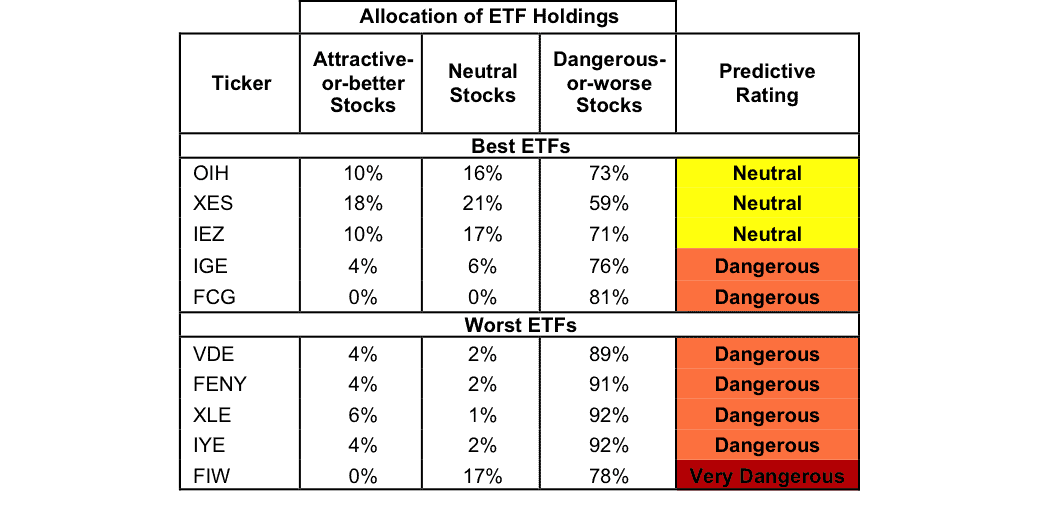
* Best ETFs exclude ETFs with TNAs less than $100 million for inadequate liquidity.
Sources: New Constructs, LLC and company filings
PowerShares Dynamic Oil & Gas Services Portfolio (PXJ) and VanEck Vectors Unconventional Oil & Gas ETF (FRAK) are excluded from Figure 1 because their total net assets (TNA) are below $100 million and do not meet our liquidity minimums.
Figure 2: Mutual Funds with the Best & Worst Ratings – Top 5

* Best mutual funds exclude funds with TNAs less than $100 million for inadequate liquidity.
Sources: New Constructs, LLC and company filings
Miller/Howard Drill Bit To Burner Tip Fund (DBBEX and DBBDX) are excluded from Figure 2 because its total net assets (TNA) are below $100 million and do not meet our liquidity minimums.
VanEck Vectors Oil Services ETF (OIH) is the top-rated Energy ETF and Invesco Energy Fund (IENIX) is the top-rated Energy mutual fund. OIH earns a Neutral rating and IENIX earns a Dangerous rating.
First Trust ISE Water Index Fund (FIW) is the worst rated Energy ETF and Saratoga Energy and Basic Materials Portfolio (SBMBX) is the worst rated Energy mutual fund. Both earn a Very Dangerous rating.
174 stocks of the 3000+ we cover are classified as Energy stocks.
Matrix Service Company (MTRX: $16/share) is one of our favorite stocks held by Energy ETFs and mutual funds and earns a Very Attractive rating. Since 1998, MTRX has grown after-tax profit (NOPAT) by 18% compounded annually. The company’s return on invested capital (ROIC) has improved from 2% in 1998 to a top-quintile 16% over the last twelve months. Despite the long-term profit growth, MTRX is significantly undervalued. At its current price of $16/share, MTRX has a price to economic book value (PEBV) ratio of 0.7. This ratio means that the market expects Matrix’s NOPAT to permanently decline by 30%. This expectation seems too pessimistic given the history of profit growth achieved by Matrix. If MTRX can grow NOPAT by just 4% compounded annually for the next decade, the stock is worth $19/share today – a 20% upside.
Consol Energy (CNX: $16/share) is one of our least favorite stocks held by Energy ETFs and mutual funds and earns a Dangerous rating. Since 2009, Consol’s NOPAT has declined by 16% compounded annually to $241 million in 2015. Over the last twelve months, NOPAT has fallen to -$31 million. Additionally, Consol’s ROIC has declined from 10% in 2009 to a bottom-quintile 0% TTM. Despite the deterioration of the business, CNX is up over 30% in the past three months alone, and the shares are overvalued. To justify its current price of $16/share, CNX must grow NOPAT by 11% compounded annually for the next 15 years. This expectation seems overly optimistic given the profit decline at CNX since 2009.
Figures 3 and 4 show the rating landscape of all Energy ETFs and mutual funds.
Figure 3: Separating the Best ETFs From the Worst ETFs
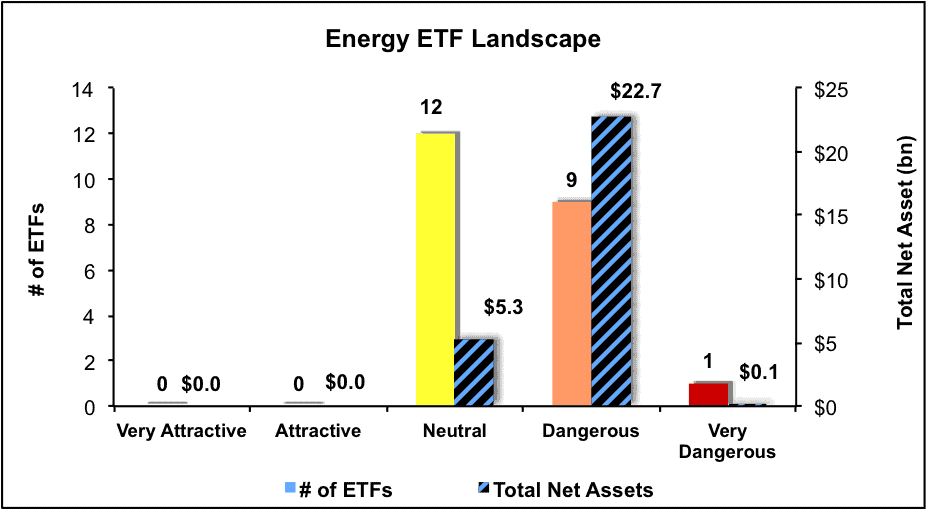
Sources: New Constructs, LLC and company filings
Figure 4: Separating the Best Mutual Funds From the Worst Mutual Funds
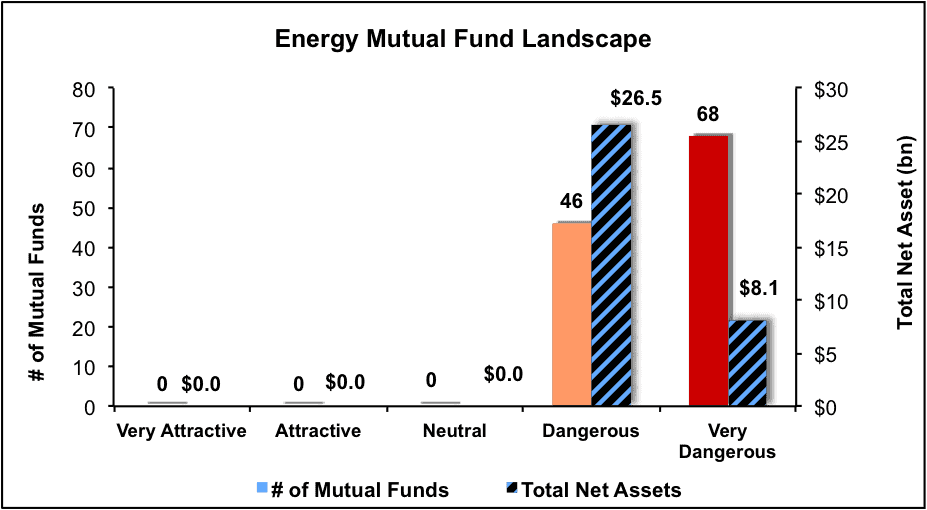
Sources: New Constructs, LLC and company filings
This article originally published here on July 12, 2016.
Disclosure: David Trainer and Kyle Guske II receive no compensation to write about any specific stock, sector or theme.
Click here to download a PDF of this report.
Photo Credit: Dave Miller (Flickr)