
The Energy sector ranks eighth out of the ten sectors as detailed in my Sector Rankings for ETFs and Mutual Funds report. It gets my Dangerous rating, which is based on aggregation of ratings of 18 ETFs and 73 mutual funds in the Energy sector as of April 23, 2013. Prior reports on the best & worst ETFs and mutual funds in every sector and style are here.
Figure 1 shows the five best and worst-rated ETFs and mutual funds in the sector. Not all Energy sector ETFs and mutual funds are created the same. The number of holdings varies widely (from 25 to 168), which creates drastically different investment implications and ratings. The best ETFs and mutual funds allocate more value to Attractive-or-better-rated stocks than the worst ETFs and mutual funds, which allocate too much value to Neutral-or-worse-rated stocks.
To identify the best and avoid the worst ETFs and mutual funds within the Energy sector, investors need a predictive rating based on (1) stocks ratings of the holdings and (2) the all-in expenses of each ETF and mutual fund. Investors need not rely on backward-looking ratings.
My fund rating methodology is detailed here.
Investors should not buy any Energy ETFs or mutual funds because none get an Attractive-or-better rating. If you must have exposure to this sector, you should buy a basket of Attractive-or-better rated stocks and avoid paying undeserved fund fees. Active management has a long history of not paying off.
Get my ratings on all ETFs and mutual funds in this sector on my free mutual fund and ETF screener.
Figure 1: ETFs with the Best & Worst Ratings – Top 5
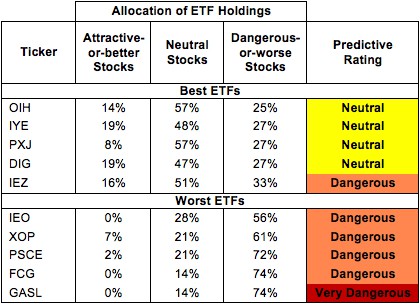 * Best ETFs exclude ETFs with TNAs less than $100 million for inadequate liquidity.
Sources: New Constructs, LLC and company filings
Figure 2: Mutual Funds with the Best & Worst Ratings – Top 5
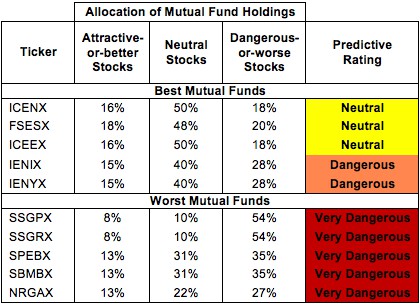 * Best mutual funds exclude funds with TNAs less than $100 million for inadequate liquidity.
Sources: New Constructs, LLC and company filings
Market Vectors Oil Services ETF (OIH) is my top-rated Energy ETF and ICON Funds: ICON Energy Fund (ICENX) is my top-rated Energy mutual fund. Both earn my Neutral rating.
Direxion Daily Natural Gs Related Bull 3x Shares (GASL) is my worst-rated Energy ETF and Northern Lights Fund Trust: Ascendant Natural Resources Fund (NRGAX) is my worst-rated Energy mutual fund. Both earn my Very Dangerous rating.
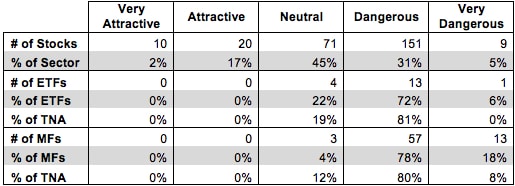
Figure 3 shows that 20 out of the 261 stocks (over 19% of the market value) in Energy ETFs and mutual funds get an Attractive-or-better rating. However, no ETFs or mutual funds get an Attractive-or-better rating. Only 9 Energy stocks (5% of the market value) are rated Very Dangerous, yet one ETF and 13 mutual funds earn a Very Dangerous rating.
It seems that the mutual fund managers and ETF providers are avoiding the good stocks. Investors in Energy sector funds are paying fees for sub-par management.
Figure 3: Energy Sector Landscape For ETFs, Mutual Funds & Stocks
 Sources: New Constructs, LLC and company filings
As detailed in “Cheap Funds Dupe Investors”, the fund industry offers many cheap funds but very few funds with high-quality stocks, or with what I call good portfolio management.
Investors need to tread carefully when considering Energy ETFs and mutual funds, as 78% of Energy ETFs and 96% of Energy mutual funds earn a Dangerous-or-worse rating. No ETFs or mutual funds in the Energy sector allocate enough value to Attractive-or-better-rated stocks to earn an Attractive rating. Investors seeking exposure to the sector should concentrate on individual stocks instead.
Marathon Oil Corp (MRO) is one of my favorite stocks held by Energy ETFs and mutual funds and earns my Very Attractive rating. MRO’s decision to spin-off its refining division in 2011 looks like a very smart move at this point. Its after-tax profit (NOPAT) in 2012 was almost the same as its 2010 NOPAT, only with $14 billion less invested capital. This improved capital efficiency helped MRO earn a return on invested capital (ROIC) of 11.5% in 2012, its highest in over a decade. Rather than recognizing MRO’s impressive cash flows, investors seem to be focusing on its loss of assets from the spin-off and its declining GAAP net income. Neither issue should affect the diligent investor’s opinion on the stock beyond the impact on the company’s ROIC per above. And yet, MRO’s current valuation of ~$30.30/share gives it a price to economic book value ratio of 0.5. This low valuation implies that MRO’s NOPAT will be permanently halved. Nothing on the company’s balance sheet or in the Energy sector as a whole suggests that such a pessimistic expectation is warranted. MRO should far exceed the market’s low expectations and reward investors.
Anadarko Petroleum Corp (APC) is one of my least favorite stocks held by Energy ETFs and mutual funds and earns my Very Dangerous rating. Only twice in the past 14 years has this company had a high enough ROIC to earn positive economic earnings. APC is currently growing its invested capital faster than its NOPAT, leading to a negative free cash flow and a declining ROIC. In addition, APC has several classic balance sheet red flags. Its pension and postretirement plans are underfunded by $1.2 billion, it has $3.5 billion in off-balance sheet debt due to operating leases, and it has asset write-downs totaling almost $7.7 billion, or 19% of net assets. Low and declining ROIC, significant liabilities on the balance sheet, and management that is destroying 19 cents of every dollar invested in the company combine to make APC Very Dangerous at almost any price.
However, the market seems unaware of these issues as APC has surprisingly high expectations for future cash flows to investors embedded in its valuation. To justify its current price of ~$81.05/share, APC would need to grow NOPAT by 12% compounded annually for 17 years. Such high expectations are unrealistic for a company with almost no track record of economic profitability. Heavy allocation to APC helps to explain the Dangerous-or-worse ratings of ETFs and mutual funds like IEO, FSNGX, and IENAX.
178 stocks of the 3000+ I cover are classified as Energy stocks, but due to style drift, Energy ETFs and mutual funds hold 261 stocks.
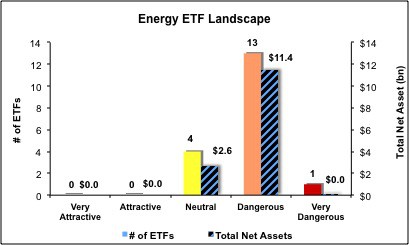
Figures 4 and 5 show the rating landscape of all Energy ETFs and mutual funds.
My Sector Rankings for ETFs and Mutual Funds report ranks all sectors and highlights those that offer the best investments.
Figure 4: Separating the Best ETFs From the Worst ETFs
 Sources: New Constructs, LLC and company filings
Figure 5: Separating the Best Mutual Funds From the Worst Mutual Funds
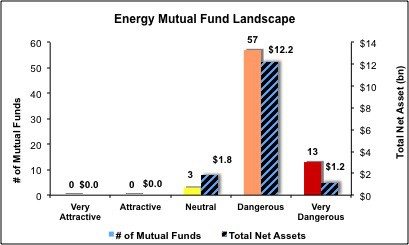 Sources: New Constructs, LLC and company filings
Review my full list of ratings and rankings along with reports on all 18 ETFs and 73 mutual funds in the Energy sector.
Sam McBride contributed to this report.
Disclosure: David Trainer owns MRO. David Trainer and Sam McBride receive no compensation to write about any specific stock, sector or theme.