The Health Care sector ranks sixth out of the ten sectors as detailed in my Sector Rankings for ETFs and Mutual Funds report. It gets my Neutral rating, which is based on aggregation of ratings of 22 ETFs and 72 mutual funds in the Health Care sector as of January 15th, 2014. Prior reports on the best & worst ETFs and mutual funds in every sector are here.
Figures 1 and 2 show the five best and worst-rated ETFs and mutual funds in the sector. Not all Health Care sector ETFs and mutual funds are created the same. The number of holdings varies widely (from 20 to 311), which creates drastically different investment implications and ratings. The best ETFs and mutual funds allocate more value to Attractive-or-better-rated stocks than the worst ETFs and mutual funds, which allocate too much value to Neutral-or-worse-rated stocks.
To identify the best and avoid the worst ETFs and mutual funds within the Health Care sector, investors need a predictive rating based on (1) stocks ratings of the holdings and (2) the all-in expenses of each ETF and mutual fund. Investors need not rely on backward-looking ratings. My fund rating methodology is detailed here.
Investors should not buy any Health Care ETFs or mutual funds because none get an Attractive-or-better rating. If you must have exposure to this sector, you should buy a basket of Attractive-or-better rated stocks and avoid paying undeserved fund fees. Active management has a long history of not paying off.
Get my ratings on all ETFs and mutual funds in this sector on my free mutual fund and ETF screener.
Figure 1: ETFs with the Best & Worst Ratings – Top 5
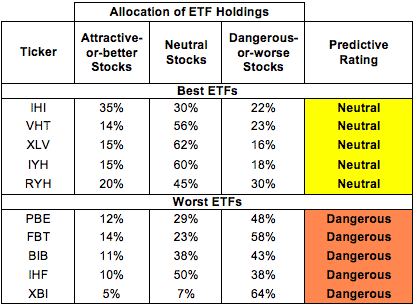 * Best ETFs exclude ETFs with TNAs less than $100 million for inadequate liquidity.
Sources: New Constructs, LLC and company filings
Fidelity MSCI Health Care Index ETF (FHLC) is excluded from Figure 1 because its total net assets (TNA) are below $100 million and do not meet our liquidity standards.
Figure 2: Mutual Funds with the Best & Worst Ratings – Top 5
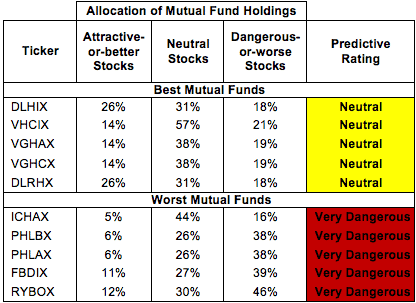 * Best mutual funds exclude funds with TNAs less than $100 million for inadequate liquidity.
Sources: New Constructs, LLC and company filings
Oak Associates Funds: Live Oak Health Sciences Fund (LOGSX) and Saratoga Advantage Trust: Health & Biotechnology Portfolio (SBHIX) are excluded from Figure 2 because their total net assets (TNA) are below $100 million and do not meet our liquidity standards.
iShares U.S. Medical Devices ETF (IHI) is my top-rated Health Care ETF and Delaware Group Equity Funds IV: Delaware Healthcare Fund (DLHIX) is my top-rated Health Care mutual fund. Both earn my Neutral rating.
State Street SPDR S&P Biotech ETF (XBI) is my worst-rated Health Care ETF and Rydex Series Funds: Biotechnology Fund (RYBOX) is my worst-rated Health Care mutual fund. XBI earns my Dangerous rating while RYBOX earns my Very Dangerous rating.
Figure 3 shows that 32 out of the 314 stocks (over 15% of the market value) in Health Care ETFs and mutual funds get an Attractive-or-better rating. However, no Health Care sector ETFs or mutual funds get an Attractive-or-better rating.
The takeaways are: mutual fund managers allocate too much capital to low-quality stocks and Health Care ETFs hold poor quality stocks.
Figure 3: Health Care Sector Landscape For ETFs, Mutual Funds & Stocks
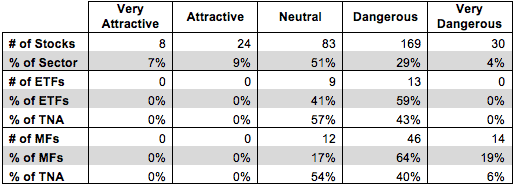 Sources: New Constructs, LLC and company filings
As detailed in “Cheap Funds Dupe Investors”, the fund industry offers many cheap funds but very few funds with high-quality stocks, or with what I call good portfolio management.
Investors need to tread carefully when considering Health Care ETFs and mutual funds, as no Health Care sector ETFs or mutual funds receive an Attractive-or-better rating. Investors would be better off by focusing on individual stocks instead.
Medtronic Inc. (MDT) is one of my favorite stocks held by IHI and earns my Attractive rating. Medtronic Inc. has grown after-tax profits (NOPAT) by 14% compounded annually over the last 15 years and generates a return on invested capital (ROIC) of 13%. $11 billion in excess cash and positive free cash flow in 9 out of the past 10 years also demonstrate the value MDT can create for investors. Despite this strong track record of profit growth, expectations for MDT remain low. At its current trading price of ~$59/share, MDT has a price-to-economic book value (PEBV) ratio of 1.1. This valuation implies that the market only expects Medtronic to increase NOPAT by 10% over the remainder of its corporate life. Such low profit growth expectations embedded in the stock combined with a strong track record of profit growth make MDT a low risk/high reward proposition.
Healthways Inc. (HWAY) is one of my least favorite stocks held by Healthcare ETFs and mutual funds and earns my Very Dangerous rating. Over the past four years, HWAY’s NOPAT has decreased by 25% compounded annually, and the company generated a bottom quintile ROIC of 3% last year. To make matters worse, HWAY has had negative and declining economic earnings for the last five years. Despite the poor performance of HWAY, its stock price is up ~60% over the past year. To justify its current valuation of ~$17, HWAY would need to grow NOPAT by 25% compounded annually for the next 12 years. The growth expectations embedded in this stock price out any potential upside while setting up a significant fall if HWAY fails to grow profits as rapidly as the market expects.
316 stocks of the 3000+ I cover are classified as Health Care stocks, but due to style drift, Health Care ETFs and mutual funds hold 314 stocks.
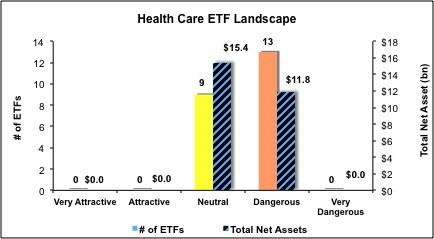
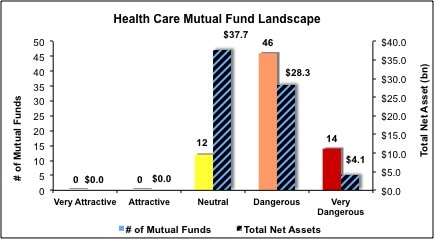
Figures 4 and 5 show the rating landscape of all Health Care ETFs and mutual funds.
My Sector Rankings for ETFs and Mutual Funds report ranks all sectors and highlights those that offer the best investments.
Figure 4: Separating the Best ETFs From the Worst ETFs
 Sources: New Constructs, LLC and company filings
Figure 5: Separating the Best Mutual Funds From the Worst Mutual Funds
 Sources: New Constructs, LLC and company filings
Review my full list of ratings and rankings along with reports on all 22 ETFs and 72 mutual funds in the Health Care sector.
Jared Melnyk and Kyle Guske II contributed to this report.
Disclosure: David Trainer, Jared Melnyk, and Kyle Guske II receive no compensation to write about any specific stock, sector or theme.