
Sector Analysis 3Q16
The Financials sector ranks seventh out of the ten sectors as detailed in our 3Q16 Sector Ratings for ETFs and Mutual Funds report. Last quarter, the Financials sector ranked sixth. It gets our Neutral rating, which is based on an aggregation of ratings of 38 ETFs and 235 mutual funds in the Financials sector as of July 12, 2016. See a recap of our 2Q16 Sector Ratings here.
Figures 1 and 2 show the five best and worst rated ETFs and mutual funds in the sector. Not all Financials sector ETFs and mutual funds are created the same. The number of holdings varies widely (from 22 to 565). This variation creates drastically different investment implications and, therefore, ratings.
Investors seeking exposure to the Financials sector should buy one of the Attractive-or-better rated ETFs or mutual funds from Figures 1 and 2.
Figure 1: ETFs with the Best & Worst Ratings – Top 5

* Best ETFs exclude ETFs with TNAs less than $100 million for inadequate liquidity.
Sources: New Constructs, LLC and company filings
State Street SPDR S&P Capital Markets (KCE), PowerShares KBW Property & Casualty Insurance (KBWP), and Oppenheimer Financials Sector Revenue (RWW) are excluded from Figure 1 because their total net assets (TNA) are below $100 million and do not meet our liquidity minimums.
Figure 2: Mutual Funds with the Best & Worst Ratings – Top 5
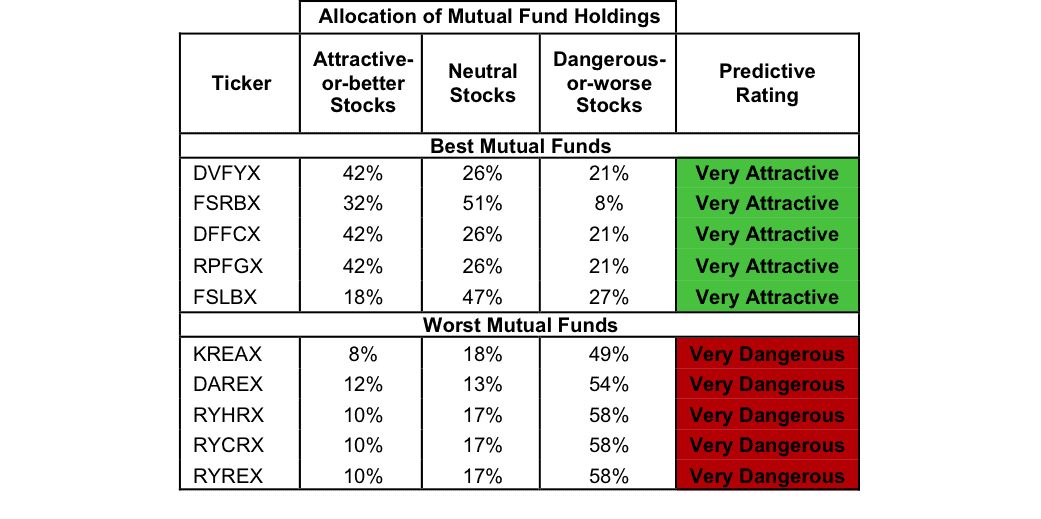
* Best mutual funds exclude funds with TNAs less than $100 million for inadequate liquidity.
Sources: New Constructs, LLC and company filings
iShares US Financial Services ETF (IYG) is the top rated Financials ETF and Davis Financial Fund (DVFYX) is the top rated Financials mutual fund. Both earn a Very Attractive rating.
PowerShares KBW High Dividend Yield Financial Portfolio (KBWD) is the worst rated Financials ETF and Rydex Series Real Estate Fund (RYREX) is the worst rated Financials mutual fund. KBWD earns a Dangerous rating and RYREX earns a Very Dangerous rating.
587 stocks of the 3000+ we cover are classified as Financials stocks.
Franklin Resources Inc. (BEN: $32/share) is one of our favorite stocks held by Financial ETFs and mutual funds and earns a Very Attractive rating. Since 2009 BEN has grown after-tax profit (NOPAT) by 16% compounded annually. Franklin Resources has improved its return on invested capital (ROIC) from 15% in 2009 to a top-quintile 26% over the last twelve months. Despite the fundamental strength, BEN is undervalued. At its current price of $32/share, BEN has a price-to-economic book value (PEBV) ratio of 0.7. This ratio means that the market expects BEN’s NOPAT to permanently decline by 30%. If BEN can grow NOPAT by 1% compounded annually for the next decade, the stock is worth $49/share today – a 53% upside.
American Campus Communities (ACC: $52/share) is one of our least favorite stocks held by DAREX and earns a Very Dangerous rating. Over the past decade, ACC’s economic earnings, its true cash flows, have declined from -$13 million to -$126 million. The company’s ROIC has fallen from 5% in 2005 to a bottom-quintile 2% over the last twelve months. Despite the clear destruction of shareholder value, ACC remains priced for significant profit growth. In order to justify its current price of $52/share, ACC must stop destroying shareholder value and grow NOPAT by 11% compounded annually for the next 13 years. This expectation seems rather optimistic given ACC’s shareholder destruction over the past decade.
Figures 3 and 4 show the rating landscape of all Financials ETFs and mutual funds.
Figure 3: Separating the Best ETFs From the Worst ETFs
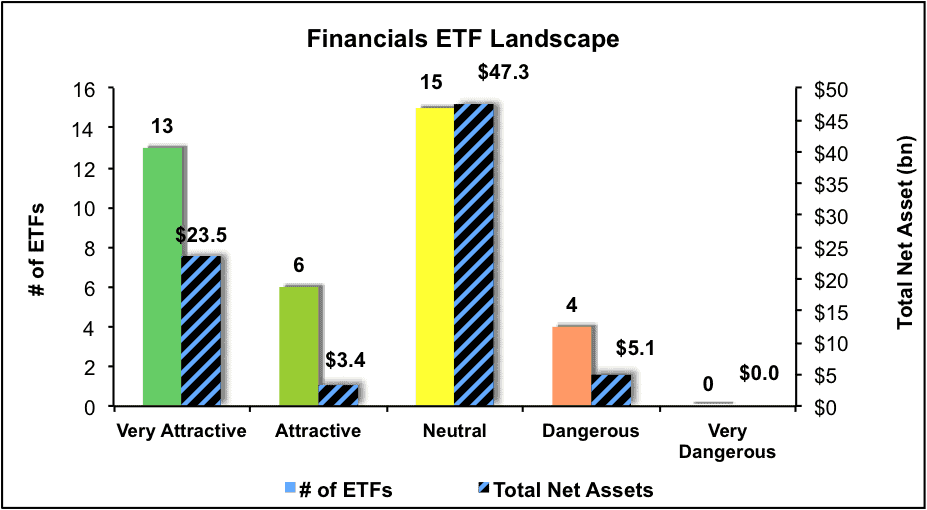
Sources: New Constructs, LLC and company filings
Figure 4: Separating the Best Mutual Funds From the Worst Mutual Funds
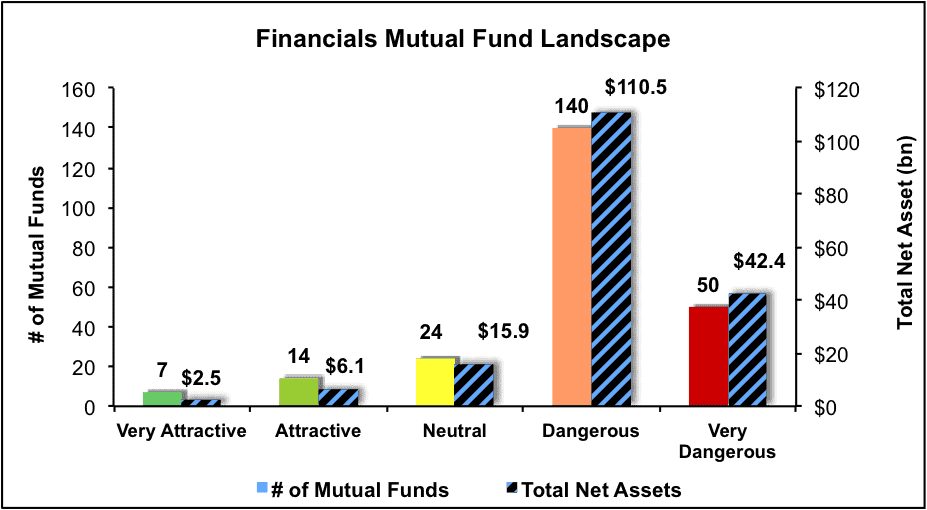
Sources: New Constructs, LLC and company filings
This article originally published here on July 12, 2016.
Disclosure: David Trainer and Kyle Martone receive no compensation to write about any specific stock, sector or theme.
Click here to download a PDF of this report.
Photo Credit: gigijin (Flickr)