
Sector Analysis 2Q16
The Telecom Services sector ranks eighth out of the ten sectors as detailed in our 2Q16 Sector Ratings for ETFs and Mutual Funds report. Last quarter, the Telecom Services sector ranked eighth as well. It gets our Dangerous rating, which is based on aggregation of ratings of six ETFs and 15 mutual funds in the Telecom Services sector as of April 20, 2016. See a recap of our 1Q16 Sector Ratings here.
Figure 1 ranks from best to worst the five Telecom Services ETFs that meet our liquidity standards and Figure 2 shows the five best and worst rated Telecom Services mutual funds. Not all Telecom Services sector ETFs and mutual funds are created the same. The number of holdings varies widely (from 24 to 59). This variation creates drastically different investment implications and, therefore, ratings.
Investors should not buy any Telecom Services ETFs or mutual funds because none get an Attractive-or-better rating. If you must have exposure to this sector, you should buy a basket of Attractive-or-better rated stocks and avoid paying undeserved fund fees. Active management has a long history of not paying off.
Figure 1: ETFs with the Best & Worst Ratings – Top 5

* Best ETFs exclude ETFs with TNAs less than $100 million for inadequate liquidity.
Sources: New Constructs, LLC and company filings
iShares North American Tech-Multimedia Networking ETF is excluded from Figure 1 because its total net assets (TNA) are below $100 million and do not meet our liquidity minimums.
Figure 2: Mutual Funds with the Best & Worst Ratings – Top 5

* Best mutual funds exclude funds with TNAs less than $100 million for inadequate liquidity.
Sources: New Constructs, LLC and company filings
Five funds are excluded from Figure 2 because their total net assets (TNA) are below $100 million and do not meet our liquidity minimums. See our mutual fund screener for more details.
State Street SPDR S&P Telecom ETF (XTL) is the top-rated Telecom Services ETF and Fidelity Select Wireless Portfolio (FWRLX) is the top-rated Telecom Services mutual fund. Both earn a Neutral rating.
iShares Global Telecom ETF (IXP) is the worst rated Telecom Services ETF and Fidelity Advisor Telecommunications Fund (FTUAX) is the worst rated Telecom Services mutual fund. IXP earns a Dangerous rating and FTUAX earns a Very Dangerous rating.
45 stocks of the 3000+ we cover are classified as Telecom Services stocks, but due to style drift, Telecom Services ETFs and mutual funds hold 59 stocks.
Atlantic Tele-Network (ATNI: $73/share) is one of our favorite stocks held by Telecom Services ETFs and mutual funds and earns an Attractive rating. Over the past five years, Atlantic Tele-Network has grown after-tax profit (NOPAT) by 13% compounded annually. The company has improved its return on invested capital (ROIC) from 5% in 2010 to 10% in 2015 while NOPAT margins have increased from 5% to 17% over the same time period. This impressive fundamental growth could help explain why ATNI is up over 90% over the past five years. However, shares remain undervalued. At its current price of $73/share, ATNI has a price-to-economic book value (PEBV) ratio of 1.1. This ratio means that the market expects ATNI’s to grow its NOPAT by only 10% over its remaining life. If Atlantic Tele-Network can grow NOPAT by just 10% compounded annually for the next five years, the stock is worth $98/share today – a 36% upside.
CenturyLink (CTL: $33/share) is one of our least favorite stocks held by FTUAX and earns a Dangerous rating. CenturyLink was placed in the Danger Zone in February 2015. CTL at one point was down over 40% since the Danger Zone was published, but has since rebounded and has become significantly overvalued again. Over the past decade, CenturyLink’s economic earnings have declined from -$152 million to -$1.2 billion. In fact, the company has never generated positive economic earnings in any year of our model, which dates back to 1998. The company’s ROIC peaked in 2009 at 7% and has since fallen to a bottom-quintile 4%. Despite the deterioration of CenturyLink’s business, the stock is priced for impressive profit growth. To justify its current price of $33/share, CTL must grow NOPAT by 8% compounded annually for the next 11 years. Given the decline in CTL’s operations, this expectation seems overly optimistic.
Figures 3 and 4 show the rating landscape of all Telecom Services ETFs and mutual funds.
Figure 3: Separating the Best ETFs From the Worst ETFs
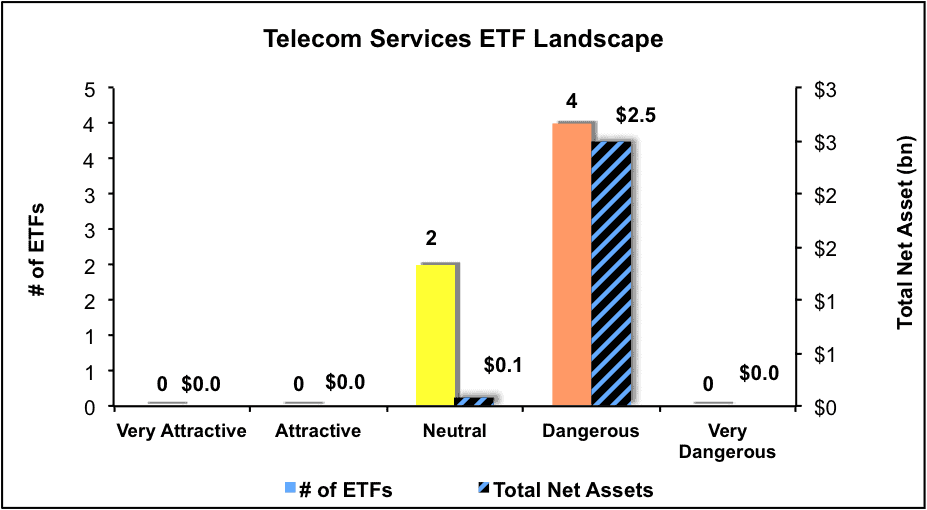
Sources: New Constructs, LLC and company filings
Figure 4: Separating the Best Mutual Funds From the Worst Mutual Funds
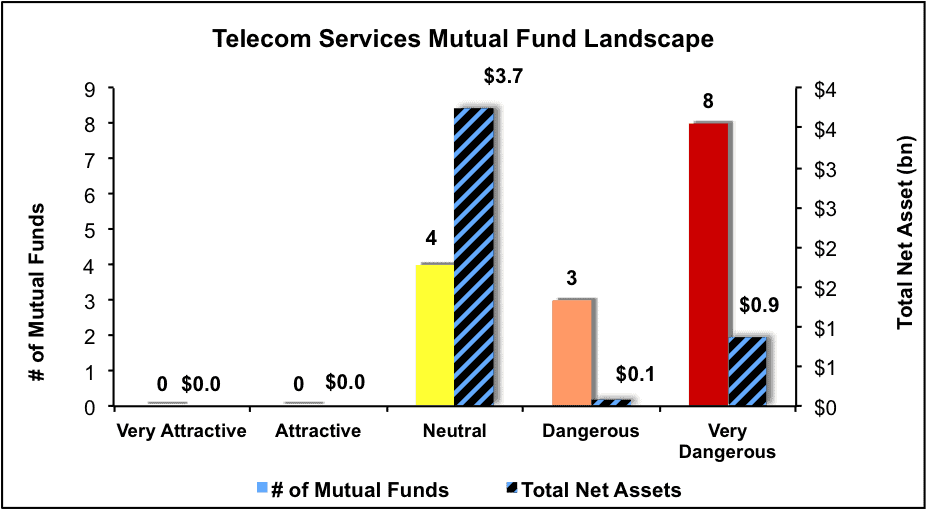
Sources: New Constructs, LLC and company filings
Disclosure: David Trainer and Kyle Guske II receive no compensation to write about any specific stock, sector or theme.
Click here to download a PDF of this report.
Photo Credit: matt smith (Flickr)