
Sector Analysis 2Q16
The Utilities sector ranks ninth out of the ten sectors as detailed in our 2Q16 Sector Ratings for ETFs and Mutual Funds report. Last quarter, the Utilities sector ranked last. It gets our Very Dangerous rating, which is based on aggregation of ratings of nine ETFs and 35 mutual funds in the Utilities sector as of April 20, 2016. See a recap of our 1Q16 Sector Ratings here.
Figure 1 ranks from best to worst the eight Utilities ETFs that meet our liquidity standards and Figure 2 shows the five best and worst rated Utilities mutual funds. Not all Utilities sector ETFs and mutual funds are created the same. The number of holdings varies widely (from 19 to 253). This variation creates drastically different investment implications and, therefore, ratings.
Investors should not buy any Utilities ETFs or mutual funds because none get an Attractive-or-better rating. If you must have exposure to this sector, you should buy a basket of Attractive-or-better rated stocks and avoid paying undeserved fund fees. Active management has a long history of not paying off.
Figure 1: ETFs with the Best & Worst Ratings – Top 5

* Best ETFs exclude ETFs with TNAs less than $100 million for inadequate liquidity.
Sources: New Constructs, LLC and company filings
Reaves Utilities ETF (UTES) is excluded from Figure 1 because its total net assets (TNA) are below $100 million and do not meet our liquidity minimums.
Figure 2: Mutual Funds with the Best & Worst Ratings – Top 5

* Best mutual funds exclude funds with TNAs less than $100 million for inadequate liquidity.
Sources: New Constructs, LLC and company filings
PowerShares DWA Utilities Momentum Portfolio (PUI) s the top-rated Utilities ETF and Wells Fargo Utility & Telecommunications Fund (EVUYX) is the top-rated Utilities mutual fund. Both earn a Dangerous rating.
PowerShares S&P SmallCap Utilities Portfolio (PSCU) is the worst rated Utilities ETF and Rydex Series Utilities Fund (RYUTX) is the worst rated Utilities mutual fund. Both earn a Very Dangerous rating.
76 stocks of the 3000+ we cover are classified as Utilities stocks, but due to style drift, Utilities ETFs and mutual funds hold 253 stocks.
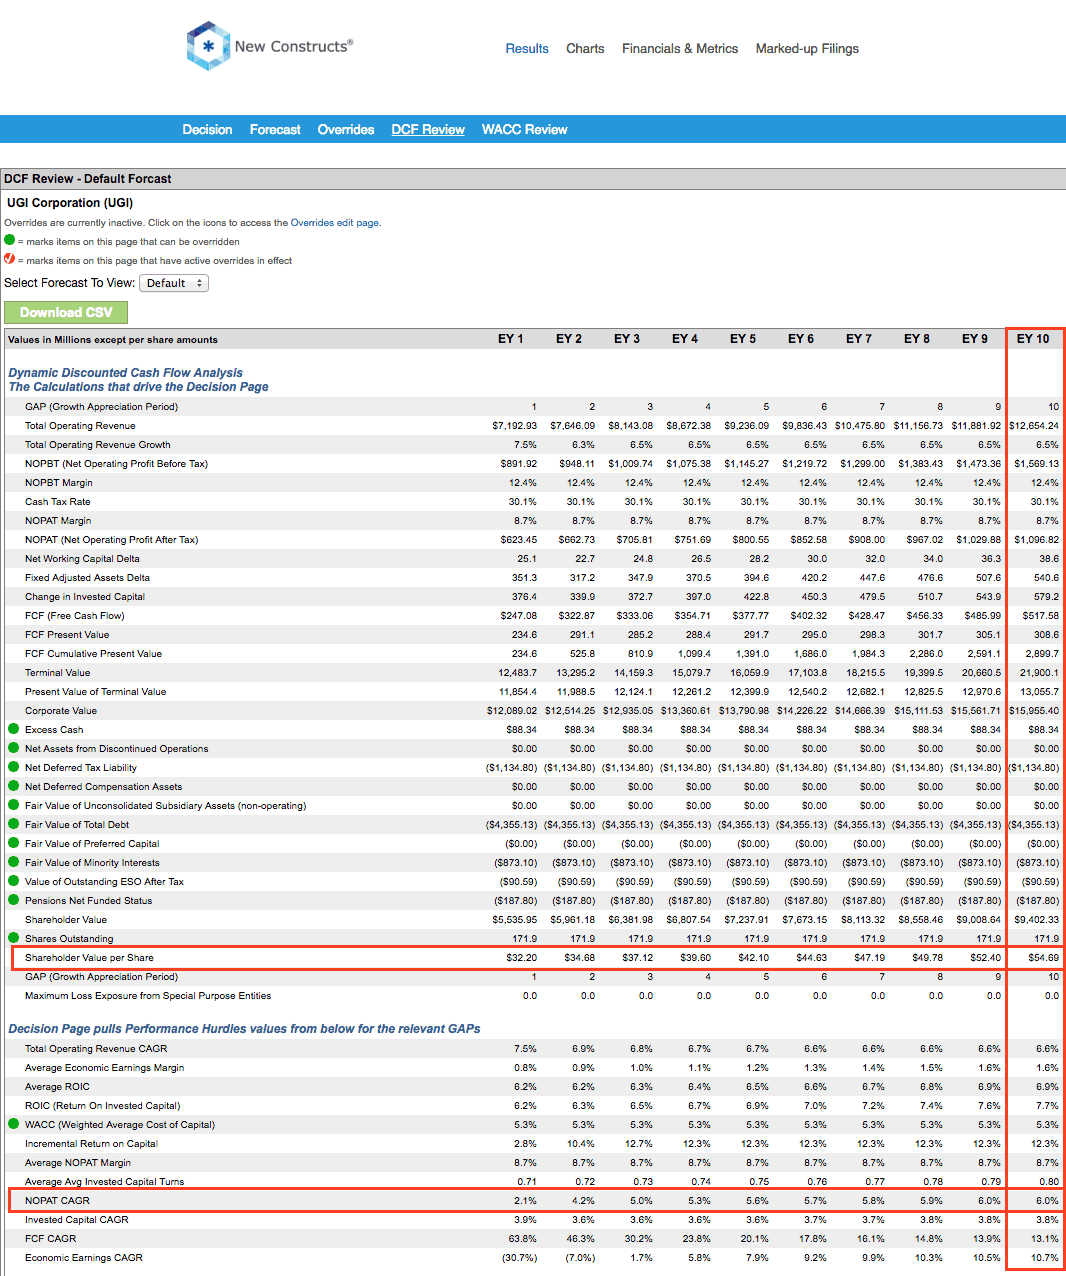
UGI Corporation (UGI: $41/share) is one of our favorite stocks held by Utilities ETFs and mutual funds and earns an Attractive rating. UGI is the only Utilities stock that receives an Attractive-or-better rating out of the 76 Utilities stocks under coverage. Over the past decade, UGI has grown after-tax profit (NOPAT) by 7% compounded annually. The company’s return on invested capital (ROIC) is currently 8%, which is up from 4% earned in 2012. UGI is undervalued given the company’s consistent profit growth and increasing profitability. At its current price of $41/share, UGI has a price-to-economic book value (PEBV) ratio of 0.9. This ratio means that the market expects UGI’s NOPAT to permanently decline by 10%. If UGI can grow NOPAT by just 6% compounded annually for the next decade, the stock is worth $55/share today – a 34% upside.
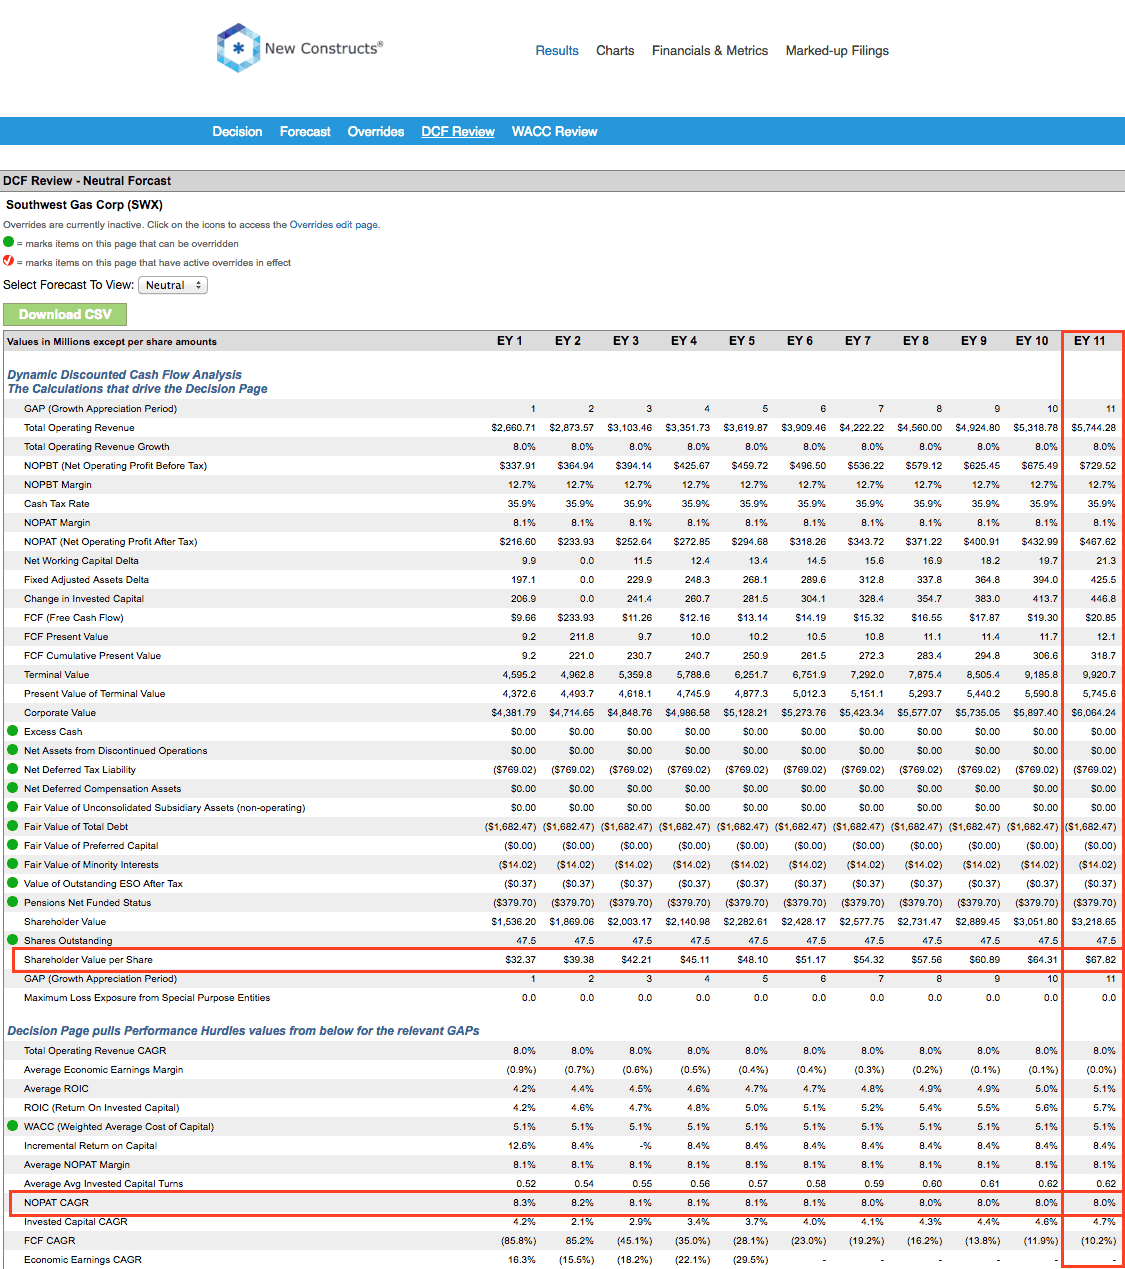
Southwest Gas Corp (SWX: $66/share) is one of our least favorite stocks held by PSCU and earns a Dangerous rating. The company has failed to generate positive economic earnings in any year of our model, which dates back to 1998. In fact, over the past four years, economic earnings have declined from -$5 million in 2012 to -$39 million in 2015. Southwest Gas Corp earns a bottom-quintile ROIC of 4% and has consistently earned a bottom-quintile ROIC since 1998. Given the poor fundamentals, SWX is significantly overvalued. To justify its current price of $66/share, SWX must grow NOPAT by 8% compounded annually for the next 11 years. The expectations embedded into the current stock price offer little upside but rather large downside risk.
Figures 3 and 4 show the rating landscape of all Utilities ETFs and mutual funds.
Figure 3: Separating the Best ETFs From the Worst ETFs
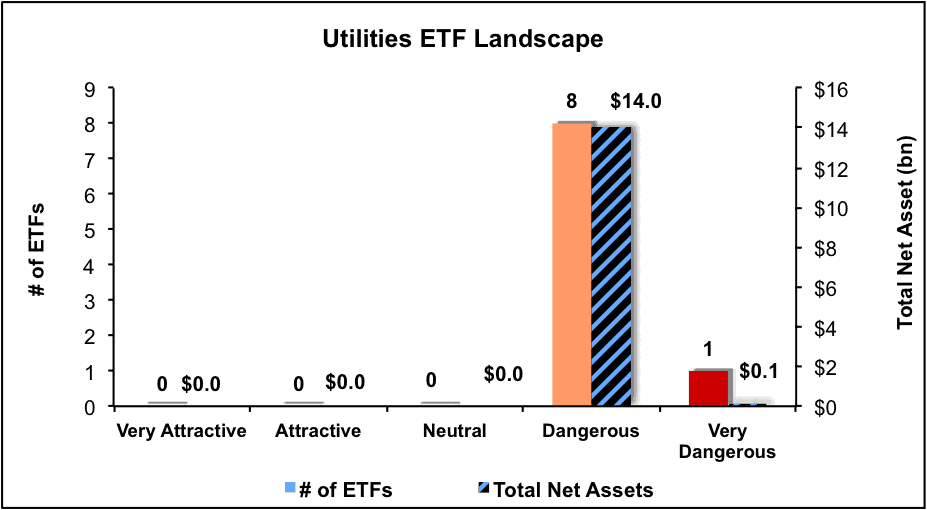
Sources: New Constructs, LLC and company filings
Figure 4: Separating the Best Mutual Funds From the Worst Mutual Funds
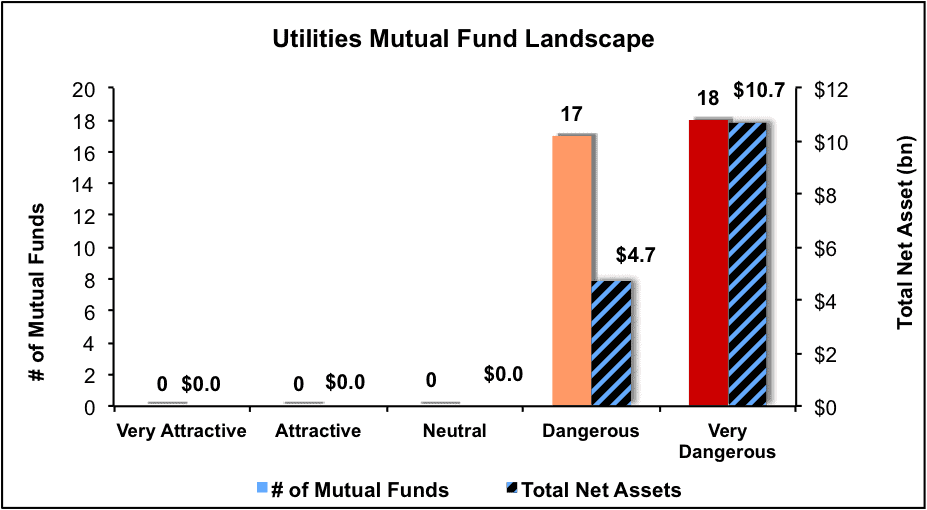
Sources: New Constructs, LLC and company filings
Disclosure: David Trainer and Kyle Guske II receive no compensation to write about any specific stock, sector or theme.
Click here to download a PDF of this report.
Photo Credit: Mark Turnauckas (Flickr)