
As the government shutdown enters its early days, our work to find hidden opportunities in an overvalued market forges on as always.
Liquified natural gas (LNG) has commanded the spotlight in the energy sector for the last few years, and investors could easily think there are no opportunities left to ride the ongoing LNG boom.
We disagree and have a stock idea for you: an LNG company that remains undervalued, even as powerful tailwinds continue to support industry growth.
Our Robo-Analyst AI Agent allows us to scour the entire market and shine lights in all the dark corners. Put simply, our technology gives you an edge when looking for good stocks in every kind of market.
Liquefied natural gas (LNG) continues to play a critical role in meeting rising global energy demand and is a cornerstone of the clean energy transition.
Despite being one of the largest LNG producers in the world and holding long-term contracts that secure future cash flows, this company’s stock trades at a significant discount. Cheniere Energy (LNG: $235/share) is this week’s Long Idea.
LNG offers favorable Risk/Reward based on the company’s:
- position as a leader in the LNG market,
- ability to capitalize on rising global LNG demand,
- contracts that ensure monetization of 95% of existing capacity through the mid 2030s,
- leading profitability in the industry, and
- stock valuation that implies permanent profit decline.
Cleaner Fossil Fuels Needed to Meet Growing Energy Demand
With rising populations, increasing industrialization, and technological advancements, such as the expansion of energy-hungry data centers, we’re not surprised to see that McKinsey forecasts global energy demand to rise from just above 600 million terajoules (TJ) in 2023 to nearly 700 million TJ in 2050.
At the same time, leaders around the world aim to meet rising demand with cleaner energy sources. However, the complete transition from fossil fuels to clean renewable energy will take much longer than expected, as we noted in Rebuild and Renew.
Case in point, the global renewables (includes solar, wind, hydro, nuclear, and other renewables) energy generation increased by just 858 terawatt hours (TWh), or just over 3 million TJ YoY in 2024, a drop (0.005%) in the bucket compared to the 600 million terajoules (TJ) of energy demand in 2023.
The bottom line is that renewable energy growth is struggling to keep up with demand growth and is not a threat to take much market share from fossil fuels anytime soon. As a result, demand for cleaner fossil fuels like natural gas and, particularly, liquefied natural gas (LNG) will continue to boom.
LNG produces 40% less carbon dioxide (CO2) than coal and 30% less than oil, which makes it the cleanest source among fossil fuels. Beyond LNG’s emission advantages, it is also a much more reliable and stable energy source compared to renewables such as solar and wind.
LNG Demand Is Booming Around the World
The rise in LNG demand is fueled by several underlying factors that will drive growth for many years to come.
1) Demand Growth in Asia
Countries in Asia are rapidly expanding their regasification (the process of turning LNG back into gas for power generation) capacity and downstream distribution infrastructure. Shell (SHEL) forecasts regasification capacity in Asia will increase from just over 600 million tonnes per annum (MTPA) in 2024 to around 800 MTPA in 2030. See Figure 1.
Figure 1: LNG Regasification Capacity in Asia: 2020 – 2030

Sources: Shell LNG Outlook 2025
Shell further forecasts more than 180 million additional people are expected to gain access to the gas grid in China and India from 2020 to 2030. The percentage of the population (China and India combined) connected to the gas grid would then increase from ~20% to 30% over the same time.
Gastech forecasts that Asia will drive more than 70% of the new global LNG demand through 2040, specifically:
- China – where LNG demand is expected to reach 150 MTPA (more than double its 2024 consumption),
- India – where LNG imports could rise beyond 50 MTPA (compared to 27 MTPA in 2024) as the country aims to increase gas to 15% of its energy mix, and
- Southeast Asia – where LNG demand is expected to triple to ~60 MTPA.
2) Energy Supply Gap in Europe and Japan
Europe, and to a lesser extent, Japan, must address the large gap between renewable energy goals and actual renewable energy supply.
In Europe, the difference between the REPowerEU policy goals and industry forecasts for 2030 show significant shortages per Figure 2.
Figure 2: Europe Power Policy Goals and Industry Forecasts in 2030

Sources: New Constructs, LLC and company filings
*GW = gigawatts
In Japan, we see similar differences between the 2030 6th Energy Plan policy goals and industry forecasts:
- nuclear – policy goal of 21% of energy mix vs. 16% industry forecast.
- renewables – policy goal of 37% of energy mix vs. 29% industry forecast.
Historically, both countries depend on LNG to meet their remaining energy needs. Figure 3 shows the gap between power demand and power supply in both Japan and Europe through 2030, a gap that we expect will continue to be filled with LNG.
Figure 3: Power Supply Gap Forecast for Europe and Japan Through 2030

Sources: Shell LNG Outlook 2025
3) Decarbonization of Hard-to-Electrify Sectors
Sectors such as shipping and heavy-duty road transport, where electrification is technically or economically challenging, are increasingly turning to LNG as a more cost-effective fuel. Marine vessels and heavy-duty trucks equipped with LNG engines can use the fuel directly without regasification, which makes LNG a cleaner and more efficient alternative to other fuel types such as diesel.
Shell projects that the LNG marine order book will nearly double from ~1,200 vessels in 2024 to just over ~2,000 vessels in 2029. Additionally, Shell forecasts LNG demand in the shipping industry to quadruple from 4 MTPA in 2024 to 16 MTPA in 2030.
Shell also forecasts that the number of LNG-fueled heavy-duty trucks in China and India will increase from just under 1 million trucks in 2024 to around 1.3 million trucks in 2030. Fueling 1.3 million trucks would require about 30 MPTA of LNG, an increase of 36% from the 22 MTPA of LNG consumed in 2024.
4) Global Rise of Digital Infrastructure
In our recent report on Black Stone Minerals (BSM), we highlighted how the growing number of data centers will fuel higher natural gas demand. In September 2025, estimates provided during the LDC Gas Forums indicate data center gas usage will rise to 4-8 billion cubic feet per day (Bcf/d) by 2030, up from 1Bcf/d.
While LNG may not directly power data centers, as it needs to be regassed to generate electricity, the rising regasification capacity across the globe should help drive further demand for LNG. Shell estimates that data centers in Japan, South Korea, Thailand, and Singapore alone could account for 2-7 MTPA of gas demand by 2030, which would represent between 2-5% of global LNG imports.
LNG can also power cooling for data centers, which further drives demand from this industry. During the regasification process, LNG absorbs heat as it returns to its gaseous state, which releases large amounts of ‘cold energy’ that is typically dissipated into seawater or other reheating systems. A new approach aims to capture and repurpose this cold energy to provide cooling for data centers and other high-density digital infrastructure. China is using this cooling technology in its LNG intelligent computing center, and Thailand and South Korea are exploring the technology as well.
Oversupply Concerns Look Overblown
As with any commodity/raw material, oversupply can quickly drop prices, reduce operator profitability, and eliminate the feasibility of many capital-intensive projects. With significant expansion capacity already under development, will demand continue to outpace supply?
Gastech estimates there is currently more than 200 MTPA of liquefication capacity under development across the globe. If all projects were to achieve full commission and be completed on time, the LNG liquefication capacity could potentially reach 700 MTPA by 2030. For reference, Gastech expects global LNG demand to grow to 650-700 Mt by 2040.
However, given rising capital costs, construction delays, regulatory hurdles, and environmental concerns, Gastech notes that “supply realisation is highly unlikely”.
Instead, Gastech outlines the more realistic scenario, named “selective growth”, where low-cost projects get completed. In this scenario, global LNG capacity would increase between 120 and 150 MTPA, which would roughly align supply and demand through 2030. In this case, LNG prices would stabilize and remain at current levels.
While Gastech provides a scenario in which supply and demand largely equal one another, Shell forecasts that even more investment is necessary to ensure supply keeps up with demand. Shell’s LNG Outlook 2025 report projects LNG demand to exceed supply between 2034–2040. See Figure 4.
Figure 4: LNG Supply and Demand Forecast Through 2040
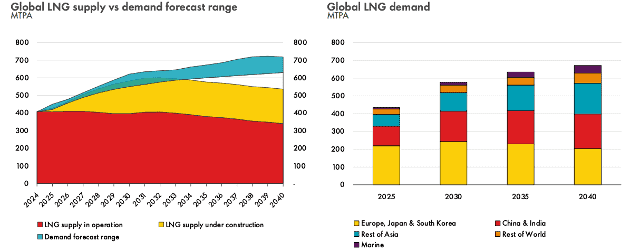
Sources: Shell LNG Outlook 2025
U.S. Remains Export Leader
The U.S. was once again the world’s largest LNG exporter in 2024, a position it first achieved in 2022. U.S. LNG exports have nearly quadrupled over the last five years. The Energy Information Administration (EIA) forecasts U.S. LNG exports will increase 36% from 2024 to 2026.
Shell forecasts that U.S. exports could potentially reach 180 MTPA by 2030 and account for a third of global supply by 2035. In this forecast, 2035 U.S. LNG export volumes are double the 2024 LNG demand of Japan and South Korea combined. By 2035, the U.S. and Qatar (the second largest LNG exporter) could account for ~60% of global LNG supply.
The United States’ Largest LNG Exporter: Cheniere Energy
Cheniere Energy is the largest LNG producer in the U.S. and second largest LNG producer in the world. The company operates two of the three largest LNG export terminals in the U.S., including the Sabine Pass Plant (largest) and Corpus Christi Plant (third largest). These two plants have >30 MTPA and >18 MTPA total production capacity in operation as of August 2025, respectively.
Cheniere currently has a combined liquefication capacity of ~48 to ~50 MTPA, which equals just above 11% of the global liquefication capacity.
Cheniere is Expanding Capacity
To meet future LNG demand, Cheniere Energy is currently expanding its Corpus Christi facility. The project, dubbed CCL3, will add around 12 MTPA of liquefication capacity by 2030. Upon completion, the company’s total liquefication capacity would reach roughly 60 – 63 MTPA. As of June 30, 2025, the CCL 3 project is ~87% complete.
Longer-term, Cheniere has already planned a Corpus Christie Stage 4 expansion and Sabine Pass Stage 5 expansion (both not yet under construction), which would add an additional 40+ MTPA and bring the company’s total liquefication capacity to around 100 MTPA.
Long-Term Contracts Lock In Future Revenue
Cheniere Energy’s business is largely insulated from spot price volatility due to the long-term nature of its contracts. These long-term sales purchase agreements (SPAs) provide stable, long-term cash flows.
Under the SPAs, customers are required to pay a fixed fee based on the contracted volume, regardless of whether the customer elects to cancel or suspend deliveries. On top of the fixed fee, the SPAs also have a variable fee, which is indexed to Henry Hub prices and structured to cover the cost of natural gas purchases, transportation, and liquefaction fuel consumed to produce LNG.
In its corporate update presentation in June 2025, Cheniere Energy noted that 95% of its capacity is already contracted through the mid 2030s, with a weighted average remaining life of long-term contracts of 16 years.
Through the contracts in place, the company has more than $120 billion in remaining fixed fee revenues through 2050.
Recently signed SPAs span the globe and include:
- JENA Co., the largest power producer in Japan, agreed to purchase 1.0 MTPA from 2029-2050.
- Galp Energia, S.A., a leader across Iberia’s (Spain and Portugal) energy sector, agreed to purchase 0.5 MTPA for 20 years, which will commence in the early 2030s.
- Foran Energy Group, one of the fastest growing natural gas companies in China, agreed to purchase 0.9 MTPA for 20 years, which will commence upon the start of commercial operations of the second train of the Sabine Pass Liquefaction Expansion Project.
- BASF, a global leader in the chemical industry located in Europe, agreed to purchase 0.8 MTPA which will commence in mid-2026 and, subject to a positive Final Investment Decision with respect to the first train of the SPL Expansion Project, will increase to approximately 0.8 MTPA upon the start of commercial operations of Train Seven. The term of the SPA extends through 2043.
- ENN, a leader in China’s natural gas industry, agreed to purchase 1.8 MTPA for 20+ years, which will commence in mid-2026, ramping up to 0.9 MPTA in 2027. Delivery of the remaining 0.9 MTPA, which is subject to a positive FID with respect to the SPL Expansion Project, will commence upon the start of commercial operations of Train Seven.
- Equinor, one of Europe’s leading energy companies, agreed to purchase 1.75 MTPA for 15+ years. Delivery of half of the volume will commence in 2027, and delivery of the remaining half, which is subject to a positive FID with respect to the first train of the SPL Expansion Project, will commence at the end of this decade. The term of the SPA is 15 years from the commencement of delivery of the full 1.75 MTPA of LNG volumes.
- PTT, the state-owned oil and gas company of Thailand, agreed to purchase 1.0 MTPA for 20 years, which will commence in 2026.
- GAIL, India’s largest state-owned natural gas company, signed a 20-year contract in 2011 which commenced in 2018, in which GAIL buys 3.5 MTPA.
Importantly, Cheniere Energy’s LNG export presence in Asia is crucial, since majority of the global LNG demand will come from the region. Cheniere Energy’s relationships with China’s ENN and India’s GAIL could play a key role in acquiring new contracts in these countries.
Cheniere Energy also recently signed contracts that guarantee the company access to natural gas feedstock, including:
- Canadian Natural Resources Limited agreed to sell Cheniere 140,000 MMBtu per day of natural gas to Cheniere Marketing for a term of 15 years, which is expected to commence in 2030.
- ARC Resources agreed to sell 140,000 MMBtu per day of natural gas to SPL Stage 5 for a term of 15 years, commencing with commercial operations of the first train (“Train 7”) of the SPL Expansion Project.
Quality Fundamentals
Cheniere Energy’s top- and bottom-line have improved significantly since the company transitioned to a pure play LNG company in 2016.
Cheniere Energy has grown revenue and net operating profit after-tax (NOPAT) by 37% and 70% compounded annually since 2016, respectively. See Figure 5. More recently, the company has grown revenue and NOPAT 12% and 18% compounded annually since 2019.
The company’s NOPAT margin improved from 5% in 2016 to 31% in the TTM, while its invested capital turns rose from 0.1 to 0.4 over the same time. Rising NOPAT margins and invested capital turns drive the company’s return on invested capital (ROIC) from 0% in 2016 to 14% in the TTM.
Figure 5: Cheniere Energy’s Revenue and NOPAT Since 2016
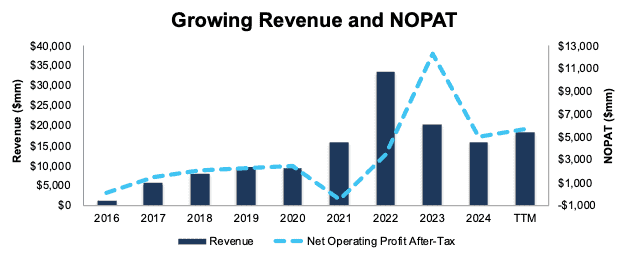
Sources: New Constructs, LLC and company filings
Leader in Profitability
Cheniere Energy not only the largest LNG producer in the U.S. and second largest in the world, but it is also more profitable than its oil & gas peers.
Cheniere Energy has the highest NOPAT margin and ROIC among the companies listed in its peer group in its proxy statement, which include EOG Resources (EOG), Targa Resources (TRGP), ConocoPhillips (COP), Baker Hughes (BKR), Phillips 66 (PSX), and more. See Figure 6.
Steady revenue from long-term contracts, coupled with prudent investment and capital expenditures create a highly profitable business. Cheniere can deploy these profits back into the business to fund expansion and thereby build on its existing scale advantages.
Figure 6: Cheniere Energy’s Profitability Vs. Peers: Trailing Twelve Months (TTM)

Sources: New Constructs, LLC and company filings
Potential for 3.2%+ Yield
Cheniere Energy increased its quarterly dividend from $0.33/share in 3Q21 to $0.50/share in 3Q25. The company paid $1.5 billion (3% of market cap) in cumulative dividends since 2021. The company’s current dividend, when annualized, provides a 0.8% yield.
Cheniere Energy also returns capital to shareholders through share repurchases. The company repurchased a total of $5.8 billion (11% of market cap) of shares since 2021. As of June 30, 2025, the company has $3.2 billion remaining under its current share repurchase authorization, which is effective through December 31, 2027. If the company were to repurchase shares at TTM rates, it would repurchase $1.3 billion shares over the next year, which would provide a yield of 2.4%.
When combined, the dividend and share repurchase yield could reach 3.2%.
Cash Flows Support Shareholder Return
Since 2021, Cheniere Energy has generated a cumulative $13.9 billion (16% of its enterprise value) in free cash flow (FCF), which is more than enough to cover its $7.3 billion in combined dividend payments ($1.5 billion) and share repurchases ($5.8 billion).
Figure 7: Cheniere Energy’s Cumulative FCF: 2021 – 2Q25

Sources: New Constructs, LLC and company filings
Cheniere has also meaningfully reduced its shares outstanding from 256 million in 2019 to 224 million in 2Q25. See Figure 8.
We like companies that choose to return capital to shareholders instead of spending it on costly acquisitions or executive bonuses that rarely drive shareholder value creation. Companies that sport strong enough cash flows to consistently lower their shares outstanding, like Cheniere Energy, offer excellent value.
Figure 8: Cheniere’s Shares Outstanding: 2019 – 2Q25

Sources: New Constructs, LLC and company filings
Cheniere’s Protection Against Higher Natural Gas Prices
Natural gas prices are likely to go up for multiple reasons:
- If U.S. domestic production of natural gas can’t keep up with increased demand, we could see natural gas prices rise.
- The rise of massive data centers is driving demand for the important feedstock as detailed in our report on Black Stone Minerals (BSM).
Bears point out that higher natural gas prices could squeeze Cheniere Energy’s margins.
However, Cheniere Energy can offset the increase in gas prices with the SPAs’ variable fee, which is based on Henry Hub natural gas prices. Cheniere Energy notes in its 10-Q that “the structure of these contracts helps limit our exposure to fluctuations in U.S. natural gas prices.”
Current Stock Price Gives You a Free Ride for Any Profit Growth
At its current price of $235/share, LNG has a price-to-economic book value (PEBV) ratio of 0.8. This ratio means the market expects the company’s profits to permanently fall 20% from current levels. This expectation seems overly pessimistic considering Cheniere Energy has:
- grown NOPAT by 70% compounded annually since 2016 and 18% compounded annually since 2019 and
- long-term contracts guaranteeing 95% of existing production will be monetized though the mid 2030s.
Below, we use our reverse discounted cash flow (DCF) model to analyze expectations for different stock valuation scenarios for LNG.
In the first scenario, we quantify the expectations baked in the current price. If we assume:
- NOPAT margin falls to 18% (below TTM margin of 31% and 23% average margin since 2016) from 2025 through 2034,
- revenue grows at consensus rates in 2025 (30%) and 2026 (15%), and
- revenue grows 3% each year thereafter through 2034 (below the company’s CAGR of 37% since 2016 and five-year CAGR of 12%), then
LNG would be worth $235/share today – equal to the current stock price. In this scenario, Cheniere Energy’s NOPAT would grow just 1% compounded annually from 2025 through 2034. For reference, LNG has grown NOPAT by 70% compounded annually since 2016 and 18% compounded annually since 2019. Contact us for the math behind this reverse DCF scenario.
In this scenario, Cheniere Energy’s revenue would equal $30.4 billion. If Cheniere Energy continues to contract the same amount (95%) of its production capacity and generate the same amount of revenue per 1 MPTA of capacity as in the TTM, then $30.4 billion in revenue implies Cheniere Energy’s capacity would reach 80 MPTA in 2034, which is lower than the 100 MPTA capacity we can expect the company to reach if all planned projects are finished.
Shares Could Go 45%+ Higher Even If Profit Margin Deteriorates
If we instead assume:
- NOPAT margin falls to 23% (equal to average margin since 2016 and below TTM margin of 31%) from 2025 to 2034,
- revenue grows at consensus rates in 2025 (30%) and 2026 (15%), and
- revenue grows 3% each year thereafter through 2034, then
LNG would be worth at least $344/share today – a 46% upside to the current price. In this scenario, LNG’s NOPAT would grow just 3% compounded annually from 2025 through 2034. Contact us for the math behind this reverse DCF scenario.
Should Cheniere Energy grow profits near historical rates, the stock has even more upside. Figure 9 compares LNG’s historical NOPAT to the NOPAT implied in each of the above DCF scenarios.
Figure 9: Cheniere Energy’s Historical and Implied NOPAT: DCF Valuation Scenarios

Sources: New Constructs, LLC and company filings
Sustainable Competitive Advantages Will Drive Shareholder Value Creation
Here’s a summary of why we think the moat around Cheniere Energy’s business will enable it to continue to generate higher NOPAT than the current market valuation implies:
- leading producer in North America and second largest in the world,
- long-term LNG demand drivers,
- rising regasification infrastructure in Asia, and
- long-term contracts that ensure revenue growth and steady cash flows.
What Noise Traders Miss with Cheniere Energy
These days, fewer investors focus on finding quality capital allocators with shareholder-aligned corporate governance. Due to the proliferation of noise traders, the focus is on short-term technical trading trends while more reliable fundamental research is overlooked. Here’s a quick summary of what noise traders are missing:
- growing capacity to meet global demand,
- industry leading profitability, and
- valuation implies profits will permanently decline by 20%.
Earnings Beats Could Send Shares Higher
Cheniere Energy has beaten earnings estimates in 9 of the past 15 quarters, including in 2Q25. Year-to-date (YTD), LNG is up 10% and outperformed its benchmark, Energy Select Sector SPDR Fund (XLE), which is up 4%. Should Cheniere Energy beat earnings again it could send shares even higher.
Additionally, continued completion of its ongoing expansion projects, continued demand growth across the globe, and additional contract wins would provide profit growth opportunities and send shares higher.
Exec Comp Could Be Improved
Cheniere Energy’s executives receive cash awards based on annual incentives and stock awards based on long-term incentives. Annual incentives are based on EBITDA, budget management (adjusted SG&A expense), operational effectiveness (asset production etc.), ESG metrics, and strategic goals (expansion progress, etc.). Stock awards are based on the company’s adjusted EBITDA, absolute total shareholder return (TSR), and cumulative distributable cash flow per share.
We would prefer the company tie executive compensation to ROIC. Doing so ensures that executives’ interests are more aligned with shareholders’ interests as there is a strong correlation between improving ROIC and increasing shareholder value. Improving ROIC requires attention to all areas of the business, so including it in an executive compensation plan would incentivize executives to improve the entire business, not just one sales goal or earnings number.
Despite using EBITDA and TSR measures, Cheniere Energy’s management has grown economic earnings, the true cash flows of the business, 23% compounded annually since 2019.
Insider Trading and Short Interest Trends
Over the past twelve months, insiders have purchased 12,642 shares and sold 189,617 shares for a net effect of 202,259 shares sold. These sales represent <1% of shares outstanding.
There are currently 4.2 million shares sold short, which equates to 2% of shares outstanding and 3.75 days to cover.
Attractive Funds That Hold LNG
The following fund receives an Attractive-or-better rating and allocate significantly to LNG:
- Trust Catalyst Energy Infrastructure Fund (MLXCX and MLXIX) – 10.5% allocation and Attractive rating.
- Tortoise Energy Infrastructure Total Return Fund (TORCX and TORIX) – 10.0% allocation and Attractive rating.
- Transamerica Energy Infrastructure Fund (TMLPX and TMCLX) – 8.7% allocation and Attractive rating.
- Northern Lights Trust Eagle Energy Infrastructure Fund (EGLIX and EGLNX) – 7.8% allocation and Very Attractive rating.
- NYLI Mainstay Cushing MLP Premier Class Fund (CSHCX) – 7.8% allocation and Attractive rating.
This article was originally published on October 2, 2025.
Disclosure: David Trainer, Kyle Guske II, and Hakan Salt receive no compensation to write about any specific stock, sector, style, or theme.
Questions on this report or others? Join our online community and connect with us directly.