
Corporate profits, when properly measured, have been much less volatile than implied by GAAP earnings since the first quarter of 2020.
This report is an abridged and free version of All Cap Index & Sectors: Core Earnings Vs. GAAP Earnings Through 3Q21, one of our quarterly series on fundamental market and sector trends. The full version of the report analyzes Core Earnings[1][2] and GAAP earnings of the NC 2000[3], our All Cap Index, and each of its sectors. Last quarter’s analysis is here. These reports are available to clients with a Pro or higher membership or can be purchased here.
Accounting Distortions Across the NC 2000
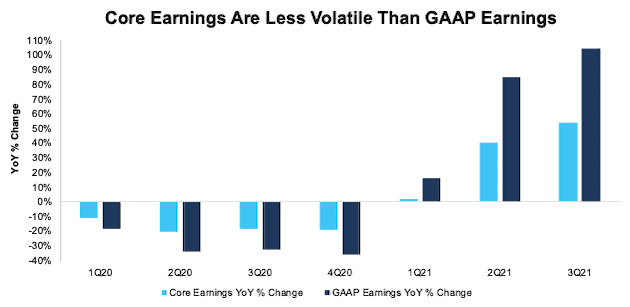
Figure 1 shows Core Earnings, which adjust for unusual gains/losses, are less volatile than GAAP earnings in the NC 2000. For instance:
- In 2021, GAAP earnings rose 105% through 3Q21 compared to a 50% rise for Core Earnings.
- In 2020, GAAP earnings fell 36% YoY compared to a 19% fall for Core Earnings.
At the end of 2020, Core Earnings of $1.2 trillion were 34% higher than GAAP earnings of $896 billion. Now, at $1.80 trillion, Core Earnings are 2% less than GAAP earnings of $1.84 trillion.
Figure 1: NC 2000 Core Earnings Vs. GAAP YoY Percent Change: 1Q20 – 3Q21
Sources: New Constructs, LLC and company filings.
Our Core Earnings analysis is based on aggregated TTM data for the sector constituents in each measurement period.
The November 16, 2021 measurement period incorporates the financial data from 3Q21 10-Qs, as this is the earliest date for which all the 3Q21 10-Qs for the NC 2000 constituents were available.
Our research leverages more reliable fundamental data[4] that overcomes flaws with legacy fundamental datasets to provide a more informed view of the fundamentals of companies and a new source of alpha.
2021 GAAP Earnings Widely Overstated
For 832 companies in the NC 2000, forty-two percent, GAAP Earnings overstate Core Earnings for the trailing-twelve-months (TTM) ended calendar 3Q21. Shockingly, when GAAP Earnings overstate Core Earnings, they do so by an average of 208%, per Figure 2. The overstatement was more than ten percent of GAAP Earnings for twenty-three percent of companies.
The 832 companies with overstated GAAP earnings make up 55% of the market cap of the NC 2000.
Figure 2: NC 2000 GAAP Earnings Overstated[5] by 188% On Average

Sources: New Constructs, LLC and company filings.
We use Funds from Operations (FFO) for Real Estate companies rather than GAAP Earnings.
Key Details on Select NC 2000 Sectors
Core Earnings rose on a year-over-year (YoY) basis for all eleven sectors of the NC 2000 in 3Q21, up from ten sectors in the second quarter. The Energy sector saw the largest YoY percentage improvement in Core Earnings, which rose from $7.9 billion in 3Q20 to $42.2 billion in 3Q21.
The Technology sector generates the most Core Earnings, at $454.1 billion, and grew Core Earnings by 48% YoY in 3Q21. On the flip side, the Real Estate sector has the lowest Core Earnings at $31.0 billion, and the Consumer Non-cyclicals sector had the weakest YoY growth in 3Q21.
Below we highlight the Technology sector and a stock with some of the most Earnings Distortion (i.e. overstated GAAP earnings) in the sector.
Sample Sector Analysis[6]: Technology
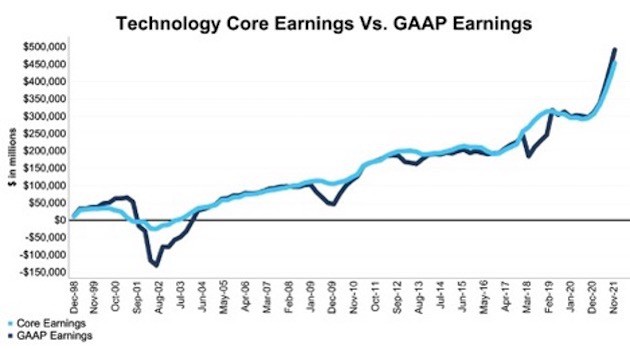
Figure 3 shows Core Earnings for the Technology sector, at $454.1 billion, rose 48% YoY in 3Q21, while GAAP earnings, at $492.0 billion, rose 58%. Our analysis of the NC 2000 and S&P 500 Technology sector illustrates disparity in profitability between the largest Technology firms and the rest of the sector.
For example, the 77 stocks in the S&P 500 Technology sector generated $443.2 billion in TTM Core Earnings in 3Q21, while the 310 stocks in the NC 2000 Technology sector generated $454.1 billion in TTM Core Earnings in 3Q21. In fact, the five most profitable Technology firms in the NC 2000, Apple (AAPL), Microsoft (MSFT), Alphabet (GOOGL), Facebook (FB), and Intel (INTC), generate $274.9 billion in Core Earnings as of 3Q21, which represents 61% of the entire NC 2000 Technology sector’s Core Earnings.
Figure 3: Technology Core Earnings Vs. GAAP: 1998 – 3Q21
Sources: New Constructs, LLC and company filings.
Our Core Earnings analysis is based on aggregated TTM data for the sector constituents in each measurement period.
The November 16, 2021 measurement period incorporates the financial data from 3Q21 10-Qs, as this is the earliest date for which all the 3Q21 10-Qs for the NC 2000 constituents were available.
GAAP Earnings Overstatement Details: DXC Technology Company (DXC)
Below, we detail the hidden and reported unusual items that aren’t captured in GAAP Earnings but are captured in Core Earnings for DXC Technology Company (DXC), a stock with some of the most Earnings Distortion, and, therefore, overstated GAAP Earnings, in the Technology sector.
After adjusting for unusual items, we find that DXC’s Core Earnings of $0.07/share over the trailing-twelve-months (TTM) are 96% less than reported GAAP Earnings of $1.53/share. DXC Technology’s Earnings Distortion Score is Strong Miss. Our stock rating for DXC is Very Unattractive and is flagged with the “Weak Internal Control” analyst note due to the auditor’s opinion that DXC failed to maintain effective internal control over financial reporting in its fiscal 2021 10-K.
Figure 4 details the differences between Core Earnings and GAAP Earnings so readers can audit our research.
Figure 4: DXC Technology’s GAAP Earnings to Core Earnings Reconciliation

Sources: New Constructs, LLC and company filings.
More details from DXC Technology’s trailing twelve months of financials[7]:
Reported Unusual Gains Pre-Tax, Net = $6.40/per share, which equals $1.6 billion and is comprised of:
- $2.4 billion in gains on disposition of businesses in the TTM period based on
- $377 million gain in 1Q22
- -$42 million loss in 4Q21
- $2.0 billion gain in 3Q21
- $36 million other income in the TTM period based on
- $102 million in income in 2Q22
- $103 million in income in 1Q22
- -$296 million in expense in 4Q21
- $127 million in income in 3Q21
- -$14 million in foreign currency losses in the TTM period based on
- -$14 million loss in 4Q21
- -$110 million in non-service cost components of net periodic pension expense in the TTM based on
- -$110 million in 4Q21
- -$117 million contra adjustment for recurring pension costs. These recurring expenses are reported in non-recurring line items, so we add them back and exclude them from Earnings Distortion.
- -$350 million in debt extinguishment costs in the TTM period based on
- -$281 million in 2Q22
- -$28 million in 1Q22
- -$41 million in 4Q21
- -$426 million in restructuring costs in the TTM period based on
- -$145 million in 2Q22
- -$67 million in 1Q22
- -$110 million in 4Q21
- -$104 million in 3Q21
Hidden Unusual Expenses, Net = -$1.18/per share, which equals -$301 million and is comprised of:
- -$186 million in impairment losses in the TTM period based on
- -$10 million in 2Q22
- -$176 million across 4Q21 and 3Q21
- -$159 million in transaction, separation, and integration costs in the TTM period based on
- -$3 million in 2Q22
- -$9 million in 1Q22
- -$51 million in 4Q21
- -$96 million in 3Q21
- $44 million in sublease income in the TTM period based on
- $17 million in 2Q22
- $9 million in 1Q22
- $8 million in 4Q21
- $10 million in 3Q21
Tax Distortion = -$3.76/per share, which equals -$960 million
- We remove the tax impact of unusual items on reported taxes when we calculate Core Earnings. It is important that taxes get adjusted so they are appropriate for adjusted pre-tax earnings.
This article originally published on December 3, 2021.
Disclosure: David Trainer, Kyle Guske II, and Matt Shuler receive no compensation to write about any specific stock, style, or theme.
Follow us on Twitter, Facebook, LinkedIn, and StockTwits for real-time alerts on all our research.
Appendix: Calculation Methodology
We derive the Core Earnings and GAAP Earnings metrics above by summing the trailing-twelve-month individual NC 2000 constituent values for Core Earnings and GAAP Earnings in each sector for each measurement period. We call this approach the “Aggregate” methodology.
The Aggregate methodology provides a straightforward look at the entire sector, regardless of market cap or index weighting and matches how S&P Global (SPGI) calculates metrics for the S&P 500.
[1] Core Earnings enable investors to overcome the flaws in legacy fundamental data and research, as proven in Core Earnings: New Data & Evidence, written by professors at Harvard Business School (HBS) & MIT Sloan for The Journal of Financial Economics.
[2] Based on the latest audited financial data, which is the 10-Q for calendar 3Q21 in most cases.
[3] The NC 2000 consists of the largest 2000 U.S. companies by market cap in our coverage. Constituents are updated on a quarterly basis (March 31, June 30, September 30, and December 31). We exclude companies that report under IFRS and non-U.S. ADR companies.
[4] Three independent studies prove the superiority of our data, models, and ratings. Learn more here.
[5] Overstated companies include all companies with Earnings Distortion >0.1% of GAAP earnings.
[6] The full version of this report provides analysis for all eleven sectors.
[7] Quarters referenced correspond to DXC Technology’s fiscal quarters.