With Wall Street insider selling near all-time highs, do you think you can trust all those buy ratings from Wall Street anymore?
In our recent training, The AI-Powered Edge: Your 2025 Investment Playbook, we showed how Wall Street research is conflicted and unreliable. Our CEO told the story about technology analysts using two sets of earnings estimates (one for institutional clients and one for the public) to fleece smaller investors.
The bottom line is that no one else has technology like ours. We deliver proven superior fundamental research to give investors an edge in any market. Let us prove it to you with a free stock pick.
Whether bear or bull market, finding strong businesses trading at undervalued prices is key to building a winning portfolio.
Scanning the entire stock market to find the best stocks is exactly what our Most Attractive Stocks Model Portfolio does for investors. By understanding the true profits of a business, coupled with rigorous analysis of a stock’s valuation, the Model Portfolio identifies profitable companies that are undervalued and hold upside potential. The results speak for themselves: the Long Large Cap Most Attractive Stocks outperformed the S&P 500 by 25% from 2021 – 3Q24.
Today, we’re giving you a free stock pick. We are sharing this month’s featured stock for our Most Attractive Stocks Model Portfolio.
This feature provides a concise summary of how we pick stocks for these Model Portfolios. It is not a full Long Idea report, but it gives you insight into the rigor of our research and approach to picking stocks. Whether you’re a subscriber or not, we think it is important that you’re able to see our research on stocks on a regular basis. We’re proud to share our work.
We update this Model Portfolio monthly. December’s Most Attractive and Most Dangerous stocks Model Portfolios were updated and published for clients on December 4, 2024.
November Performance Recap
Our Most Attractive Stocks (+2.4%) outperformed the S&P 500 (+2.0%) last month by 0.4%. The best performing large cap stock gained 18%, and the best performing small cap stock was up 73%. Overall, 15 out of the 40 Most Attractive stocks outperformed the S&P 500.
The Most Attractive/Most Dangerous Model Portfolios underperformed as an equal-weighted long/short portfolio by 1.3%.
Free Featured Stock: Rex American Resources Corp (REX)
Rex American Resources (REX: $41/share) is the featured stock from December’s Most Attractive Stocks Model Portfolio.
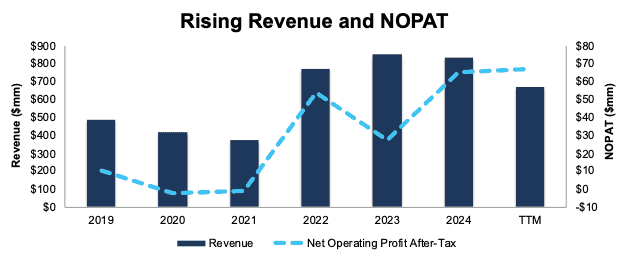
Rex American Resources has grown revenue and net operating profit after tax (NOPAT) by 6% and 38% compounded annually since fiscal 2019, respectively. Rex American Resources’ NOPAT margin increased from 2% in fiscal 2019 to 10% in the TTM while invested capital turns rose from 1.5 to 2.1 over the same time. Rising NOPAT margins and invested capital turns drive Rex American Resources’ return on invested capital (ROIC) from 3% in fiscal 2019 to 21% in the TTM.
Figure 1: Rex American Resources’ Revenue and NOPAT Since Fiscal 2019
Sources: New Constructs, LLC and company filings
Rex American Resources Is Undervalued
At its current price of $41/share, REX has a price-to-economic book value (PEBV) ratio of 0.7. This ratio means the market expects Rex American Resources’ NOPAT to permanently decline by 30%. This expectation seems overly pessimistic for a company that has grown NOPAT by 5% compounded annually since fiscal 2014 and 38% compounded annually since fiscal 2019.
Even if Rex American Resources’ NOPAT margin falls to 6% (below TTM NOPAT margin of 10%) and the company’s revenue grows just 2% (below five-year compound annual growth rate of 6%) compounded annually through fiscal 2034, the stock would be worth $53/share today – a 29% upside. In this scenario, Rex American Resources’ NOPAT would fall 1% compounded annually through fiscal 2034. Should Rex American Resources grow profits more in line with historical levels, the stock has even more upside.
Critical Details Found in Financial Filings by Our Robo-Analyst Technology
Below are specifics on the adjustments we made based on Robo-Analyst findings in Rex American Resources’ 10-Qs and 10-Ks:
Income Statement: we made over $35 million in adjustments, with a net effect of removing just under $5 million in non-operating expenses. Professional members can see all adjustments made to Rex American Resources’ income statement on the GAAP Reconciliation tab on the Ratings page on our website.
Balance Sheet: we made over $370 million in adjustments to calculate invested capital with a net decrease of over $310 million. One of the most notable adjustments was for asset write downs. Professional members can see all adjustments made to Rex American Resources’ balance sheet on the GAAP Reconciliation tab on the Ratings page on our website.
Valuation: we made over $440 million in adjustments to shareholder value, with a net increase of around $220 million. The most notable adjustment was for excess cash. Professional members can see all adjustments to Rex American Resources’ valuation on the GAAP Reconciliation tab on the Ratings page on our website.
This article was originally published on December 19, 2024.
Disclosure: David Trainer, Kyle Guske II, and Hakan Salt receive no compensation to write about any specific stock, style, or theme.
Questions on this report or others? Join our online community and connect with us directly.
[1] Our research utilizes our Core Earnings, a more reliable measure of profits, as proven in Core Earnings: New Data & Evidence, written by professors at Harvard Business School (HBS) & MIT Sloan and published in The Journal of Financial Economics.

