
Check out this week’s Danger Zone interview with Chuck Jaffe of Money Life.
This report details how we handle the very complex disclosure of unusual items from Ford’s (F: $7/share) 2006 10-K and underscores the importance of rigorous analysis of footnotes to understanding true core earnings.
We chose these disclosures because the authors of Core Earnings: New Data and Evidence recently asked us about them as part of preparing to submit the paper to a peer-reviewed journal. Specifically, they wanted details about the location of the unusual items in the filings because S&P Global (SPGI) was unable to provide the location of these unusual items in any of its datasets.
This report highlights the advantages and expertise of our Robo-Analyst, which enables us to find non-recurring items like the ones featured in this report, across thousands of companies in a matter of seconds. Investors using legacy data providers, or worse yet, using only reported numbers, in their fundamental analysis are in the Danger Zone this week.
While this example is from 2006, we scale this diligence across ~2,900 actively traded stocks with historical data going back to 1998. During this year’s filing season (February 17-March 31) alone, our Robo-Analyst parsed and analyzed 2,522 10-Ks and 10-Qs and collected over 254,000 data points. Our analyst team used this data to make 40,617 core earnings and balance sheet adjustments with a dollar value of $19 trillion.
Impact of Unusual Items: Net $4.9 Billion Impact on Reported Results
In 2006, Ford’s earnings distortion, or the unusual gains/losses that must be stripped out to calculate true core earnings totaled -$4.9 billion (3% of revenue) in 2006, or -$2.61/share. Ford’s true core earnings in 2006 were -$4.10/share compared to -$6.72/share in reported GAAP EPS.
Below is our core earnings to GAAP net income reconciliation, which we provide for all stocks under coverage.
Core Earnings: -$7,705
+ Earnings Distortion from Hidden Total Restructuring Expenses, Net: -$8,698
+ Earnings Distortion from Hidden Legal, Regulatory, and Insurance Related Expenses, Net: $110
+ Earnings Distortion from Hidden Derivative Related Expenses, Net: $43
+ Earnings Distortion from Hidden Non-Recurring Pension Expenses, Net: $815
+ Earnings Distortion from Reported Other Financing Expenses, Net: $1,478
+ Income Tax Distortion: $1,612
+ Earnings Distortion from Reported Loss/(Gain) from Discontinued Operations After-tax, Net: $2
= GAAP Net Income: -$12,613
Why Footnotes Matter: $8 Billion in Hidden Unusual Items
We know from Operating Lease Disclosures: Best & Worst Practices, that companies do not always comply with FASB standards or disclose financial data in a consistent manner.
Investors looking only at reported GAAP net income would be led to believe that Ford’s 2006 results were significantly worse than the true recurring profits of the business. As noted above, and shown in Figure 1, Ford reported GAAP net income of -$12.6 billion in 2006, which included multiple write-downs in what could be described as a “kitchen-sink year.”
In the same year, core earnings, while still negative, were just -$7.7 billion. Earnings distortion from hidden items alone totaled -$8 billion, or -$4.26/share.
Figure 1: Ford’s Core Earnings Vs. GAAP Net Income: 2004-2008
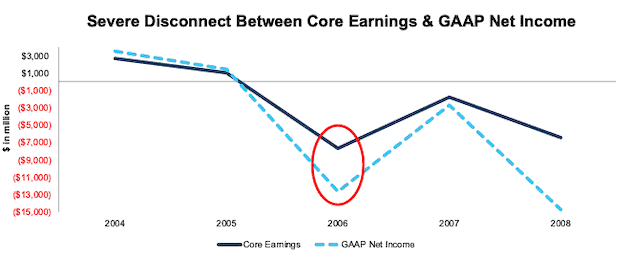
Sources: New Constructs, LLC and company filings
Discerning Duplicate Disclosures in MD&A and Footnotes
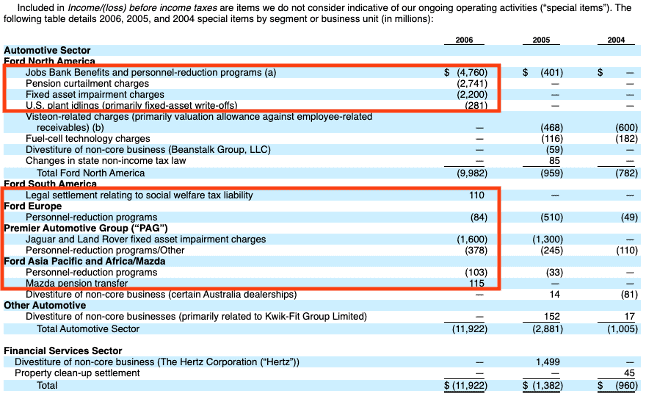
In many cases, companies bury unusual and non-operating items that impact reported profits in both the management discussion & analysis (MD&A) and footnotes, thereby making it more difficult for analysts to figure out which charges should affect earnings. Ford discloses many unusual items, i.e. “special items,” in a table on page 41 of its 2006 10-K, in the MD&A.
This table, seen in Figure 2, provides a list of the items included in “Income/(loss) before income taxes” that Ford does not consider indicative of the ongoing operations of the business. Highlighted in Figure 2 are ten non-operating items that must be analyzed in more detail and accounted for to calculate Ford’s core earnings.
Figure 2: Ford’s “Special Items” Table on Page 41 of 2006 10-K
Sources: New Constructs, LLC and company filings
Three of the unusual items are found only within this table, as detailed below:
- $4.8 billion non-operating expense related to Jobs Bank Benefits and personnel-reduction programs
- $281 million in asset write-downs related to U.S. plant idlings
- $110 million in non-operating income related to a legal settlement relating to social welfare tax liability
These non-operating items increased GAAP net losses by $4.9 billion, or $2.63/share.
Footnotes Provide Necessary Context When Building Our Valuation Models
The seven other non-operating items in Figure 2 are missing key context needed to discern their impact on NOPAT and invested capital and ensure we are not double-counting any items. We have to go to the footnotes to get the necessary context.
Below, we’ll detail where we found each of these items and how we adjust for them to calculate core earnings.
- Pension curtailment charges of $2.741 billion
We determined this charge is already included within “interest income and other non-operating income/(expense), net” reported on the income statement. During 2006, companies could report pension curtailment charges within either operating or non-operating items, so the disclosure is very inconsistent between companies.
When making any adjustment, we first try to find specific disclosures in the financial statements before analyzing the MD&A and footnotes. When there is no additional information to be found in the MD&A or footnotes, as in this case, we have to make a judgment call as to whether this item is captured in an operating or non-operating item on the income statement. In this situation, we assume this item is bundled in a non-operating item on the income statement for two reasons: (1) the non-operating item on the income statement increased by an amount close to the pension curtailment charge over the prior period and (2) counting this non-recurring pension charge as hidden in another operating item, e.g. SG&A, causes an unusually large change in the operating line item. In other words, our model shows us that including the charge in the non-operating income statement item results in a more normal trend in the values of non-operating and operating items on the income statement.
- Fixed asset impairment charges of $2.2 billion
Critical context for this asset impairment charge is found on page FS-21 (page 103 overall). The charge, equal to $1.17/share, was recorded in Automotive cost of sales and represented the amount by which the carrying value of the assets exceeded the fair value. We remove this non-operating expense from COGS.
Figure 3: $2.2 Billion Fixed Asset Impairment Charge: Page FS-21 of Ford’s 2006 10-K
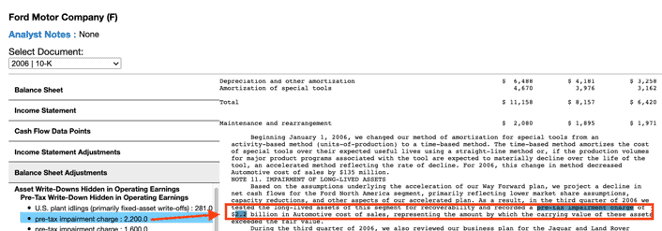
Sources: New Constructs, LLC and company filings
- Jaguar and Land Rover fixed asset impairment charges of $1.6 billion
Additional information on this asset impairment charge can also be found on page FS-21 (page 103 overall). This charge ($0.85/share) is also recorded in Automotive cost of sales and artificially increased Ford’s cost of sales. We also remove this charge from COGS.
Figure 4: $1.6 Billion Jaguar & Land Rover Asset Impairment Charge: Page FS-21 of Ford’s 2006 10-K
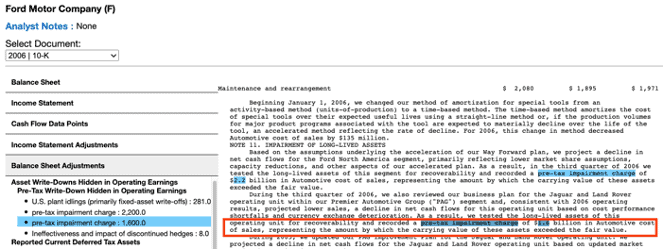
Sources: New Constructs, LLC and company filings
The last four items are all pension related and accounted for in our model with information collected from the pension section of Ford’s footnotes (begins on Page FS-44, page 126 overall).
- Personnel-reduction programs/Other of $378 million
- Mazda pension transfer income of $115 million
- Personnel-reduction programs of $103 million
- Personnel-reduction programs of $84 million
Even though each individual value doesn’t specifically match a value on the pension section, we know that pension expenses have to be included within the Net Period Benefit Costs table. For instance, the personnel-reduction program charges are included in the Separation Programs items on Page FS-47 (page 129 overall).
In general, we avoid collecting pension charges from locations other than the pension section of a firm’s footnotes because the footnotes consistently provide the best disclosure. Doing so would double count these charges and provide an inaccurate assessment of Ford’s true core earnings.
Figure 5: Pension Charges: Page FS-47 of Ford’s 2006 10-K
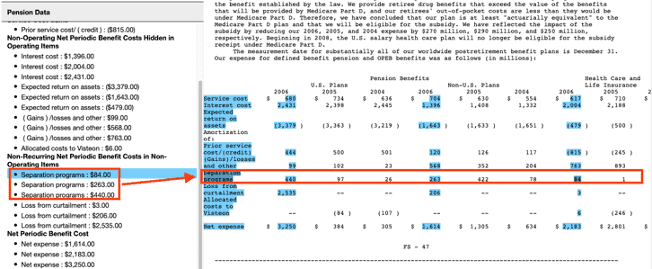
Sources: New Constructs, LLC and company filings
Diligence Scaled Across ~5600 Companies
As shown above, investors cannot always rely on tables in the MD&A to get an accurate assessment of core earnings, even when it appears a company discloses unusual items in a useful table. Further investigation of footnotes is often required.
It is important to note that we’ve spent over 15 years endowing our Robo-analyst technology with the insights and expertise of a sophisticated analyst. Unlike the legacy data providers, we are not blindly collecting data for the sake of collecting data. Instead, our focus is on providing the most comprehensive and accurate models for our clients. As a result, we bring a much higher level of attention and expertise to the data collection process.
By leveraging our Robo-Analyst technology, we’re able to provide the rigorous footnotes & MD&A analysis above across ~2,900 actively traded stocks and ~2,700 inactive stocks. This unmatched diligence shines a light in the dark corners of financial filings (i.e. footnotes) and provides clients with more accurate measures of earnings and valuation.
One of the ways, we package this diligence is in our Earnings Distortion Scores, which measure the likelihood of a company to miss expectations in the next quarter.
This article originally published on October 12, 2020.
Disclosure: David Trainer, Kyle Guske II, and Matt Shuler receive no compensation to write about any specific stock, style, or theme.
Follow us on Twitter, Facebook, LinkedIn, and StockTwits for real-time alerts on all our research.