For the week of 2/10/20-2/14/20, we focus on the Earnings Distortion Scores for 73 companies.
Our proprietary measure of earnings distortion leverages cutting-edge ML technology featured in Core Earnings: New Data & Evidence. This paper empirically concludes that our adjusted core earnings is superior to:
- “Street Earnings” from Refinitiv’s IBES, owned by Blackstone (BX) and Thomson Reuters (TRI), and
- “Income Before Special Items” from Compustat, owned by S&P Global (SPGI)
The paper also shows that investors with better earnings research have a clear advantage in predicting:
- Future earnings (Section 3.4)
- Future stock prices (Section 4.3)
Our Earnings Distortion Scores[1] empower investors to make smarter investments with superior data as well as defend against management efforts to obfuscate financial performance. The aggregate level of earnings distortion recently reached levels not seen since right before the tech bubble and the financial crisis.
Weekly Earnings Distortion Insights
Figure 1 contains the 15 largest (by market cap) S&P 500 companies, plus those with market caps greater than $10 billion, that we expect to beat or miss earnings expectations the week of February 10, 2020.
Figure 1: Earnings Distortion Scorecard Highlights: Week of 2/10/20-2/14/20
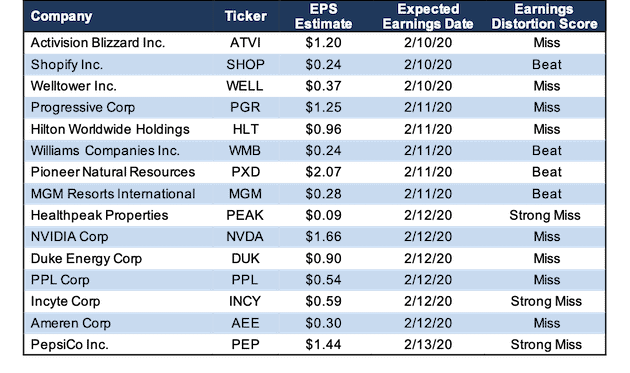
Sources: New Constructs, LLC and company filings
The appendix shows the Earnings Distortion Scores for all the S&P 500 companies, plus those with market caps greater than $10 billion, that are expected to report earnings the week of February 10, 2020.
Details: WMB’s Earnings Distortion
Over the trailing twelve months (TTM), Williams Companies (WMB: $21/share) had -$939 million in net earnings distortion that cause earnings to be understated. Notable unusual expenses in the firm’s filings include:
- $1.9 billion in impairment of certain assets – Page 76 2018 10-K
- $74 million in impairment of equity-method investments – Page 6 1Q19 10-Q
- $64 million in impairment of certain assets – Page 6 2Q19 10-Q
The largest impairment in WBM’s filings is a write-down in its operations in the Mid-Continent and Marcellus South regions, certain NGL pipeline assets, and an olefins pipeline project in the Gulf Coast. The other impairments related to WMB’s ownership in UEOM and certain assets in the Eagle Ford Shale.
These expenses were partially offset by a $692 million gain on sale related to the divestiture of operations in the Gulf Coast and the Four Corners area of New Mexico and Colorado.
In total, we identified $0.77/share (618% of reported EPS) in net unusual expenses in WMB’s TTM GAAP results. After removing this earnings distortion from GAAP net income, we see that WMB’s TTM core earnings of $0.90/share are significantly above its GAAP EPS of $0.13, per Figure 2.
With understated earnings, and a “Beat” Earnings Distortion Score, WMB is likely to beat the $1.01/share IBES consensus estimate for fiscal 2019.
Figure 2: WMB Core Earnings Vs. GAAP: 2015 – TTM
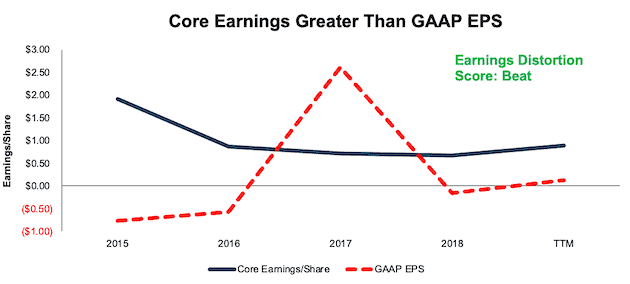
Sources: New Constructs, LLC and company filings
Figure 1 shows that WMB is one of four companies that earn our “Beat” rating for this week. Eight companies earn our “Miss” rating for this week. Three companies earn a “Strong Miss” rating, which means we’re more confident in their potential to miss earnings expectations than we are of those companies that earn a “Miss” rating.
How to Make Money with Earnings Distortion Data
“Trading strategies that exploit {adjustments provided by New Constructs} produce abnormal returns of 7-to-10% per year.” – Page 1 in Core Earnings: New Data & Evidence
In Section 4.3, professors from HBS & MIT Sloan present a long/short strategy that holds the stocks with the most understated EPS and shorts the stocks with the most overstated earnings.
This strategy produced abnormal returns of 7-to-10% a year. Click here for more details on our data offerings.
We Provide 100% Audit-ability & Transparency
Clients can audit all of the unusual items used in our calculations in the Marked-Up Filings section of each of our Company Valuation models. We are 100% transparent about what goes into our research because we want investors to trust our work and see how much goes into building the best earnings quality and valuation models.
This article originally published on February 3, 2020.
Disclosure: David Trainer, Kyle Guske II, and Matt Shuler receive no compensation to write about any specific stock, sector, style, or theme.
Follow us on Twitter, Facebook, LinkedIn, and StockTwits for real-time alerts on all our research.
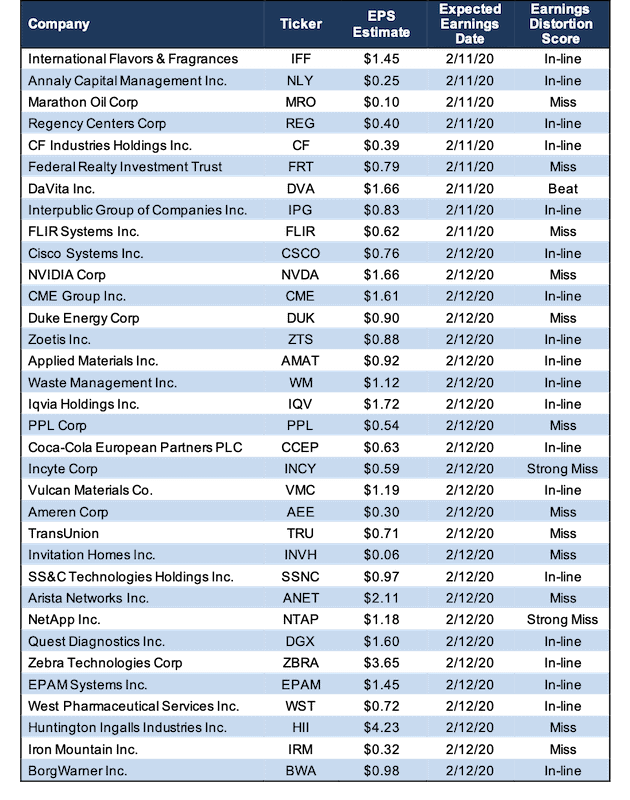
Appendix: All Major Companies That Report February 10-14
Figure 3 shows all the S&P 500 companies, plus those with market caps greater than $10 billion, that are expected to report earnings the week of February 10, 2020.
Figure 3: Earnings Distortion Scorecard: Week of 2/10/20-2/14/20
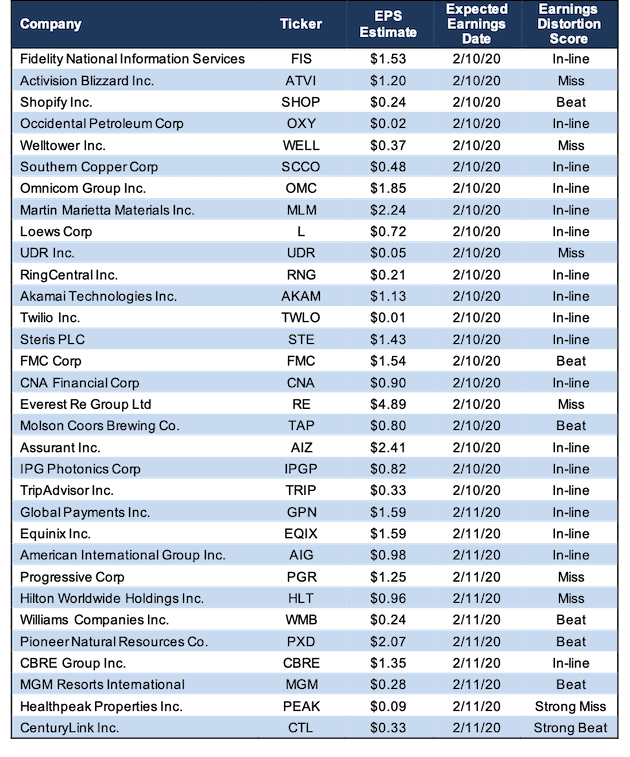
Sources: New Constructs, LLC and company filings
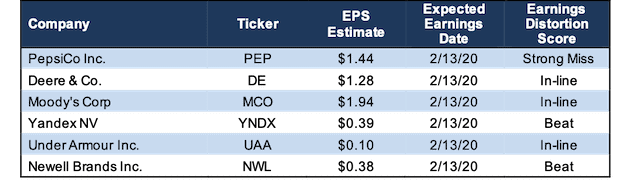
Figure 3: Earnings Distortion Scorecard: Week of 2/10/20-2/14/20 (continued)
Sources: New Constructs, LLC and company filings
Figure 3: Earnings Distortion Scorecard: Week of 2/10/20-2/14/20 (continued)
Sources: New Constructs, LLC and company filings
[1] Note that Earnings Distortion scores are also available to clients of our website.