For the week of 2/3/20-2/7/20, we focus on the Earnings Distortion Scores for 115 companies.
We measure earnings distortion using a proprietary human-assisted ML technology featured in Core Earnings: New Data & Evidence. This paper empirically concludes that our “novel dataset” is superior to:
- “Street Earnings” from Refinitiv’s IBES, owned by Blackstone (BX) and Thomson Reuters (TRI), and
- “Income Before Special Items” from Compustat, owned by S&P Global (SPGI).
The paper also shows that investors with better earnings research have a clear advantage in predicting:
- Future earnings (Section 3.4)
- Future stock prices (Section 4.3).
Our Earnings Distortion Scores[1] empower investors to make smarter investments with superior data as well as defend against management efforts to obfuscate financial performance. The aggregate level of earnings distortion recently reached levels not seen since right before the tech bubble and the financial crisis.
Weekly Earnings Distortion Insights
Figure 1 contains the 15 largest (by market cap) S&P 500 companies, plus those with market caps greater than $10 billion, that we expect to beat or miss earnings expectations the week of February 3, 2020.
Figure 1: Earnings Distortion Scorecard Highlights: Week of 2/3/20-2/7/20
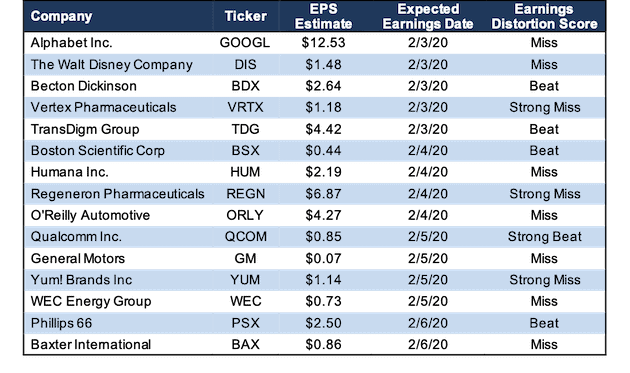
Sources: New Constructs, LLC and company filings
The appendix shows the Earnings Distortion Scores for all the S&P 500 companies, plus those with market caps greater than $10 billion, that are expected to report earnings the week of February 3, 2020.
Details: TDG’s Earnings Distortion
In 2019, TransDigm Group (TDG: $620/share) had -$193 million in net earnings distortion that cause earnings to be understated. Notable unusual expenses buried in the fine print of the firm’s 2019 10-K include:
- $77 million in amortization of inventory step-up expenses – Page F-7 (Page 78 overall)
- $61 million in acquisition integration costs – Page 25
- $31 million in acquisition transaction-related expenses – Page 25
In total, we identified $3.42/share (25% of reported EPS) in net unusual expenses in TDG’s 2019 results. After removing this earnings distortion from GAAP net income, we see that TDG’s 2019 core earnings of $17.26/share are significantly above its GAAP EPS of $13.84.
The analyst consensus for TDG’s fiscal Q1 2020 earnings is $4.42/share, which comes out to $17.68/share on an annualized basis. Based on GAAP earnings, current analysts’ estimates imply an increase of 28% in annualized earnings. Figure 2 shows that, after removing earnings distortion, consensus estimates imply a much more conservative increase of just 2%.
Figure 2: TDG Core Earnings Vs. GAAP: 2016- Fiscal 1Q 2020
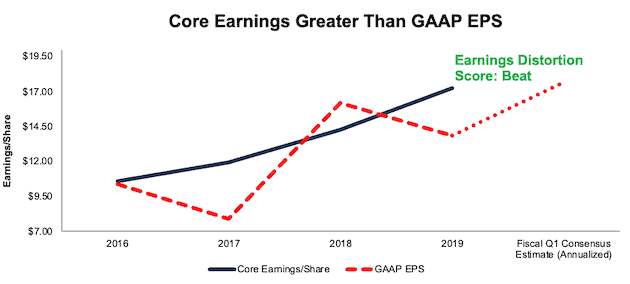
Sources: New Constructs, LLC and company filings
Figure 1 shows that TDG is one of four companies that earn our “Beat” rating for this week. One company earns a “Strong Beat” rating, which means we’re more confident in its potential to beat earnings expectations than we are of those companies that earn a “Beat” rating.
How to Make Money with Earnings Distortion Data
“Trading strategies that exploit {adjustments provided by New Constructs} produce abnormal returns of 7-to-10% per year.” – Page 1 in Core Earnings: New Data & Evidence
In Section 4.3, professors from HBS & MIT Sloan present a long/short strategy that holds the stocks with the most understated EPS and shorts the stocks with the most overstated earnings.
This strategy produced abnormal returns of 7-to-10% a year. Click here for more details on our data offerings.
We Provide 100% Audit-ability & Transparency
Clients can audit all of the unusual items used in our calculations in the Marked-Up Filings section of each of our Company Valuation models. We are 100% transparent about what goes into our research because we want investors to trust our work and see how much goes into building the best earnings quality and valuation models.
This article originally published on January 27, 2020.
Disclosure: David Trainer, Kyle Guske II, Sam McBride, and Matt Shuler receive no compensation to write about any specific stock, sector, style, or theme.
Follow us on Twitter, Facebook, LinkedIn, and StockTwits for real-time alerts on all our research.
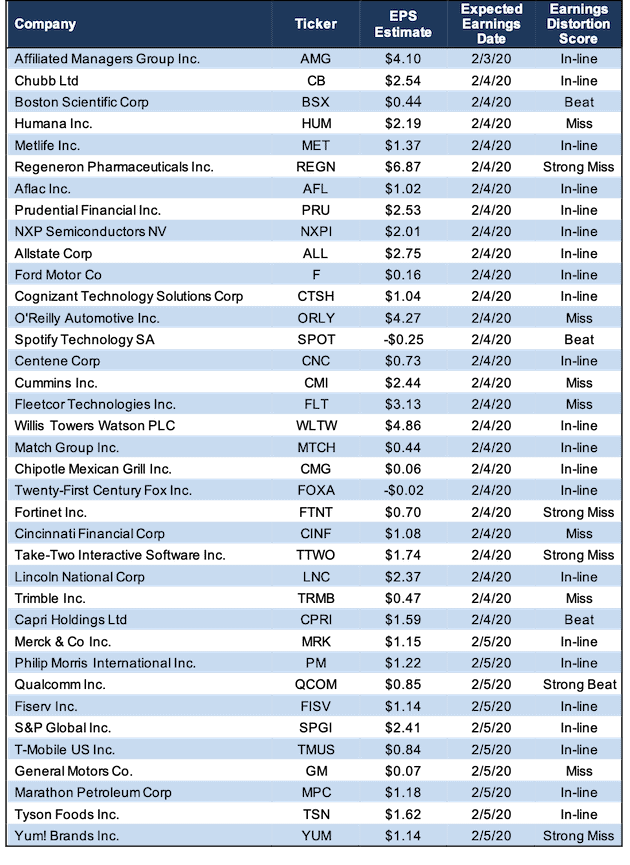
Appendix: All Major Companies That Report February 3-7
Figure 3 shows all the S&P 500 companies, plus those with market caps greater than $10 billion, that are expected to report earnings the week of February 3, 2020.
Figure 3: Earnings Distortion Scorecard: Week of 2/3/20-2/7/20
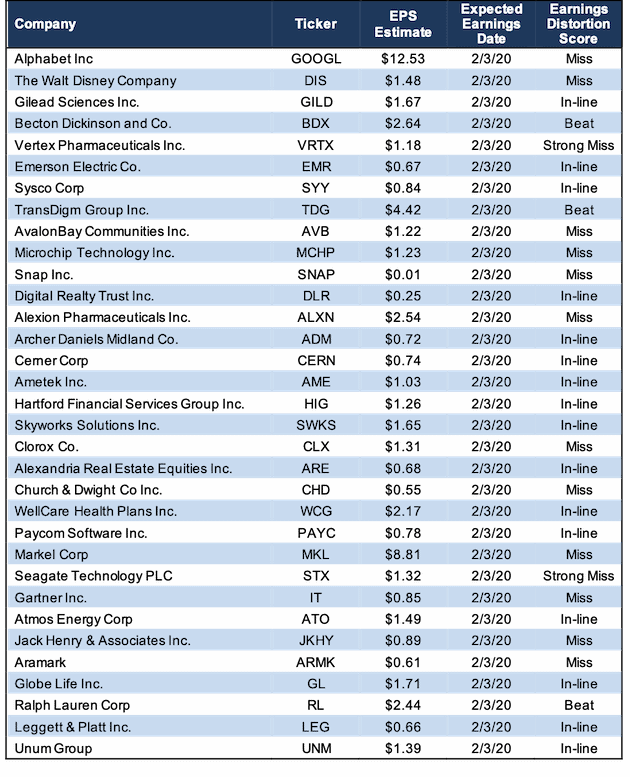
Sources: New Constructs, LLC and company filings
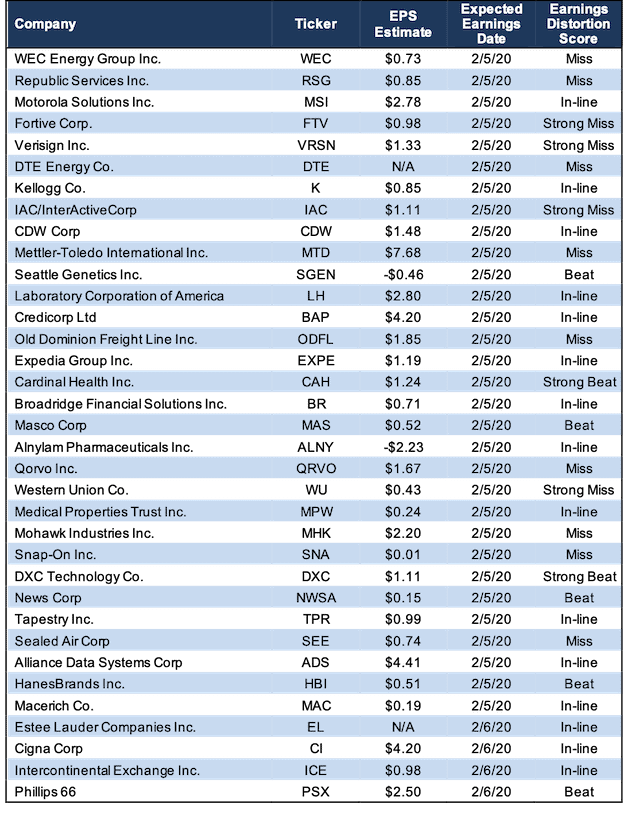
Figure 3: Earnings Distortion Scorecard: Week of 2/3/20-2/7/20 (continued)
Sources: New Constructs, LLC and company filings
Figure 3: Earnings Distortion Scorecard: Week of 2/3/20-2/7/20 (continued)
Sources: New Constructs, LLC and company filings
Figure 3: Earnings Distortion Scorecard: Week of 2/3/20-2/7/20 (continued)
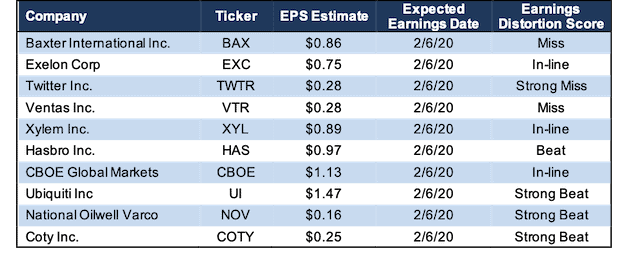
Sources: New Constructs, LLC and company filings
[1] Note that Earnings Distortion scores will be added to our website on the Ratings and Portfolios pages in January 2020.