
Four new stocks made June’s Safest Dividend Yields Model Portfolio, which was made available to members on June 22, 2023.
Recap from May’s Picks
On a price return basis, our Safest Dividend Yields Model Portfolio (+7.1%) outperformed the S&P 500 (+4.4%) by 2.7% from May 19, 2023 through June 20, 2023. On a total return basis, the Model Portfolio (+7.8%) outperformed the S&P 500 (+4.8%) by 3.0% over the same time. The best performing large-cap stock was up 15%, and the best performing small-cap stock was up 27%. Overall, ten out of the 20 Safest Dividend Yield stocks outperformed their respective benchmarks (S&P 500 and Russell 2000) from May 19, 2023 through June 20, 2023.
This report leverages our cutting-edge Robo-Analyst technology to deliver proven-superior[1] fundamental research and support more cost-effective fulfillment of the fiduciary duty of care.
This Model Portfolio only includes stocks that earn an Attractive or Very Attractive rating, have positive free cash flow (FCF) and economic earnings, and offer a dividend yield greater than 3%. Companies with strong free cash flow provide higher quality and safer dividend yields because strong FCF supports the dividend. We think this portfolio provides a uniquely well-screened group of stocks that can help clients outperform.
Featured Stock for June: MDC Holdings Inc. (MDC: $45/share)
MDC Holdings (MDC) is the featured stock in June’s Safest Dividend Yields Model Portfolio.
Since 2012, MDC Holdings has grown revenue by 16% compounded annually and net operating profit after tax (NOPAT) by 27% compounded annually. MDC Holdings’ NOPAT margin improved from 5% in 2012 to 12% over the trailing-twelve-months (TTM), while invested capital turns increased from 0.6 to 1.1 over the same time. Rising NOPAT margins and invested capital turns drive the company’s return on invested capital (ROIC) from 3% in 2012 to 13% over the TTM.
Figure 1: MDC Holdings’ Revenue & NOPAT Since 2012
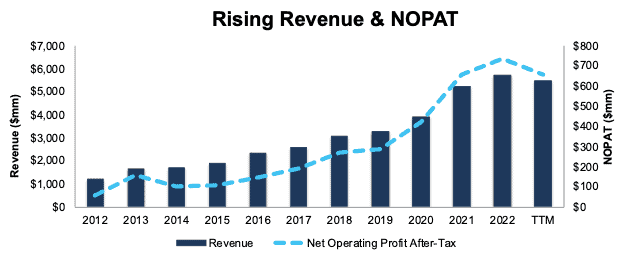
Sources: New Constructs, LLC and company filings
Cumulative Free Cash Flow Exceeds Regular Dividend Payments
MDC Holdings has increased its regular dividend from $0.23/share in 2017 to $0.50/share in 1Q23. The current quarterly dividend, when annualized, equals $2.00/share and provides a 4.5% dividend yield.
More importantly, MDC Holdings’ cumulative free cash flow (FCF) exceeds its regular dividend payments. From 2017 to 1Q23, MDC Holdings generated $1.0 billion (31% of current enterprise value) in FCF while paying $579 million in dividends. See Figure 2.
Figure 2: MDC Holdings’ FCF Vs. Regular Dividends Since 2017
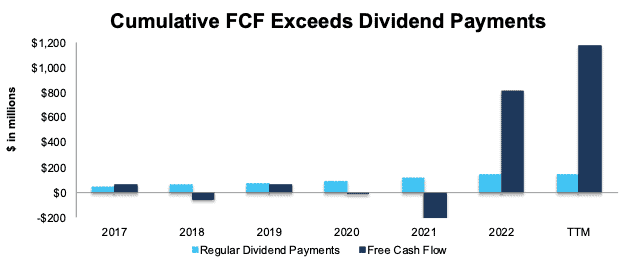
Sources: New Constructs, LLC and company filings
As Figure 2 shows, MDC Holding’ regular dividends are backed by a large cumulative cash flow. Dividends from companies with consistent low or negative FCF are less dependable since the company may not be able to sustain paying dividends.
MDC Is Undervalued
At its current price of $45/share, MDC Holdings has a price-to-economic book value (PEBV) ratio of 0.4. This ratio means the market expects MDC Holdings’ NOPAT to permanently fall 60% from TTM levels. This expectation seems overly pessimistic given that MDC Holdings has grown NOPAT by 27% compounded annually since 2012 and 7% compounded annually since 2002.
Even if MDC Holdings’ NOPAT margin falls to 9% (10-year average vs 12% TTM) and the company’s revenue declines at consensus rates for three years and grows by just 3% each year thereafter through 2032, the stock would be worth $58+/share today – a 29% upside. See the math behind this reverse DCF scenario. In this scenario, MDC Holdings’ NOPAT would fall 6% compounded annually through 2032. Should the company’s NOPAT grow more in line with historical growth rates, the stock has even more upside.
Critical Details Found in Financial Filings by Our Robo-Analyst Technology
Below are specifics on the adjustments we make based on Robo-Analyst findings in MDC Holdings’ 10-K and 10-Qs:
Income Statement: we made $275 million in adjustments with a net effect of removing $178 million in non-operating expense (3% of revenue). Clients can see all adjustments made to MDC Holdings’ income statement on the GAAP Reconciliation tab on the Ratings page on our website.
Balance Sheet: we made $2.0 billion in adjustments to calculate invested capital with a net increase of $220 million. The most notable adjustment was $1.1 billion (23% of reported net assets) in asset write-downs. See all adjustments made to MDC Holdings’ balance sheet on the GAAP Reconciliation tab on the Ratings page on our website.
Valuation: we made $2.5 billion in adjustments, with a net decrease of $64 million in shareholder value. The most notable adjustment to shareholder value was $1.2 billion in excess cash. This adjustment represents 37% of MDC Holdings’ market value. See all adjustments to MDC Holdings’ valuation on the GAAP Reconciliation tab on the Ratings page on our website.
This article was originally published on June 27, 2023.
Disclosure: David Trainer, Kyle Guske II, Hakan Salt, and Italo Mendonça receive no compensation to write about any specific stock, style, or theme.
Questions on this report or others? Join our Society of Intelligent Investors and connect with us directly.
[1] Our research utilizes our Core Earnings, a more reliable measure of profits, as proven in Core Earnings: New Data & Evidence, written by professors at Harvard Business School (HBS) & MIT Sloan and published in The Journal of Financial Economics.