
This report highlights last month’s top performers and features a stock from the current portfolio. February’s Dividend Growth Stocks Model Portfolio was made available to members on February 28, 2018.
Recap from January’s Picks
Our Dividend Growth Stocks Model Portfolio underperformed the S&P 500 last month. The Model Portfolio fell 3.2% on a price return basis and 3.1% on a total return basis. The S&P 500 fell 3.0% on a price return and total return basis. The portfolio’s best performing stock was Cisco Systems (CSCO), which was up 7%. Overall, 11 out of the 30 Dividend Growth Stocks outperformed the S&P last month.
The long-term success of our model portfolio strategies highlights the value of our Robo-Analyst technology, which scales our forensic accounting expertise (featured in Barron’s) across thousands of stocks[1].
The methodology for this model portfolio mimics an All-Cap Blend style with a focus on dividend growth. Selected stocks earn an Attractive or Very Attractive rating, generate positive free cash flow (FCF) and economic earnings, offer a current dividend yield >1%, and have a 5+ year track record of consecutive dividend growth. This model portfolio is designed for investors who are more focused on long-term capital appreciation than current income, but still appreciate the power of dividends, especially growing dividends.
Featured Stock from February: Discover Financial Services (DFS: $76/share)
Credit card provider Discover Financial Services (DFS) is the featured stock from February’s Dividend Growth Stocks Model Portfolio. DFS was first featured as a Long Idea in February 2011. Since then, the stock is up over 250% while the S&P is up 107%. DFS was also featured in our recent Filing Season Finds report, where we found that the company is significantly more profitable than its reported income suggests.
Since 2012, DFS’ revenue has grown 5% compounded annually while after-tax profit (NOPAT) has grown 7% compounded annually. DFS’ NOPAT margin has improved from 22% in 2012 to 24% in 2017 while its return on invested capital (ROIC) improved from 17% to 20%.
Figure 1: DFS Revenue & NOPAT Since 2012
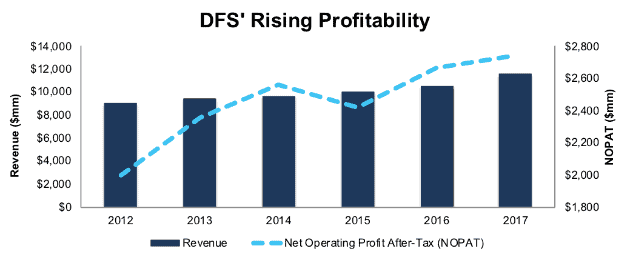
Sources: New Constructs, LLC and company filings
Steady Dividend Growth Supported by FCF
DFS has increased its annual dividend for seven consecutive years. The current annualized dividend has grown from $0.60/share in 2013 to $1.30/share in 2017, or 21% compounded annually. Positive FCF has fueled dividend growth in the past and should continue to do so in the future. From 2013-2017, DFS generated cumulative FCF of $10.8 billion (40% of market cap) and paid out cumulative dividends of $2.4 billion.
Companies with FCF well in excess of dividend payments provide higher quality dividend growth opportunities because we know the firm generates the cash to support the current dividend as well as a higher dividend. On the flip side, the dividend growth trajectory of a company where FCF falls short of the dividend payment over time cannot be trusted to grow or sustain its dividend because of inadequate free cash flow.
Figure 2: Free Cash Flow (FCF) vs. Regular Dividend Payments
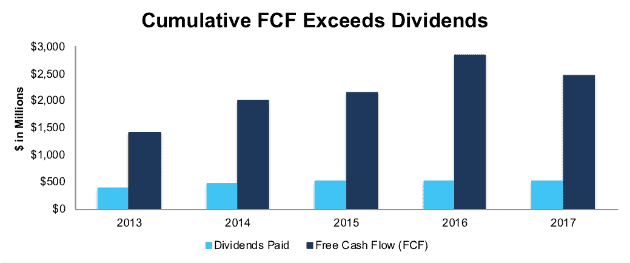
Sources: New Constructs, LLC and company filings
DFS Remains Undervalued
At its current price of $76/share, DFS has a price-to-economic book value (PEBV) ratio of 0.7. This ratio means the market expects DFS’ NOPAT to permanently decline by 30% from current levels. This expectation seems overly pessimistic for a firm that has grown NOPAT by 11% compounded annually over the past decade.
If DFS can maintain current NOPAT margins (24% in 2017) and grow NOPAT by 5% compounded annually over the next decade, the stock is worth $137/share today – an 80% upside. Add in Discover’s 1.8% dividend yield and history of dividend growth, and it’s clear why this stock is in February’s Dividend Growth Stocks Model Portfolio.
Auditable Impact of Footnotes & Forensic Accounting Adjustments
Our Robo-Analyst technology enables us to perform forensic accounting with scale and provide the research needed to fulfill fiduciary duties. In order to derive the true recurring cash flows, an accurate invested capital, and a real shareholder value, we made the following adjustments to Discover’s 2017 10-K:
Income Statement: we made $761 million of adjustments with a net effect of removing $711 million in non-operating expense (6% of revenue). We removed $736 million related to non-operating expenses and $25 million related to non-operating income. See all adjustments made to DFS’ income statement here.
Balance Sheet: we made $3.7 billion of adjustments to calculate invested capital with a net increase of $2.9 billion. The most notable adjustment was $2.6 billion (24% of reported net assets) related to total reserves. See all adjustments to DFS’ balance sheet here.
Valuation: we made $815 million of adjustments with a net effect of decreasing shareholder value by $815 million. There were no adjustments that increased shareholder value. The largest adjustment to shareholder value was $563 million in preferred capital. This adjustment represents 2% of DFS’ market value. Despite the decrease in shareholder value, DFS remains undervalued.
This article originally published on March 6, 2018.
Disclosure: David Trainer and Kyle Guske II receive no compensation to write about any specific stock, style, or theme.
Follow us on Twitter, Facebook, LinkedIn, and StockTwits for real-time alerts on all our research.
[1] Ernst & Young’s recent white paper “Getting ROIC Right” proves the superiority of our holdings research and analytics.
Click here to download a PDF of this report.
Photo Credit: TheDigitalWay (Pixabay)