
13 new stocks make our Safest Dividend Yield Model Portfolio this month, which was made available to members on February 22, 2018 and featured in Barron’s on February 24, 2018.
Recap from January’s Picks
Our Safest Dividend Yield Model Portfolio underperformed the S&P 500 last month. The Model Portfolio fell 5.1% on a price return basis and 5.0% on a total return basis. The S&P 500 fell 3.2% on a price return and total return basis. The best performing stocks in the portfolio were large cap stock Kellogg Company (K), which was up 5%, and small cap stock, DineEquity (DIN), which was up 20%. Overall, six out of the 20 Safest Dividend Yield stocks outperformed the S&P and Russell 2000 in January.
This Model Portfolio leverages our Robo-Analyst technology, which scales our forensic accounting expertise (featured in Barron’s) across thousands of stocks.[1]
This Model Portfolio only includes stocks that earn an Attractive or Very Attractive rating, have positive free cash flow and economic earnings, and offer a dividend yield greater than 3%. Companies with strong free cash flow provide higher quality and safer dividend yields because we know they have the cash to support the dividend. We think this portfolio provides a uniquely well-screened group of stocks that can help clients outperform.
Featured Stock for February: Omnicom Group (OMC: $77/share)
Omnicom Group (OMC), a global advertising, marketing, and corporate communications services provider, is the featured stock in February’s Safest Dividend Yields Model Portfolio.
Since 2009, OMC has grown revenue 3% compounded annually while after-tax profit (NOPAT) has grown 5% compounded annually, per Figure 1. NOPAT margins have increased from 8% in 2009 to 10% in 2017 while the company’s return on invested capital (ROIC) improved from 10% to 14%.
Figure 1: OMC Revenue & NOPAT Since 2009
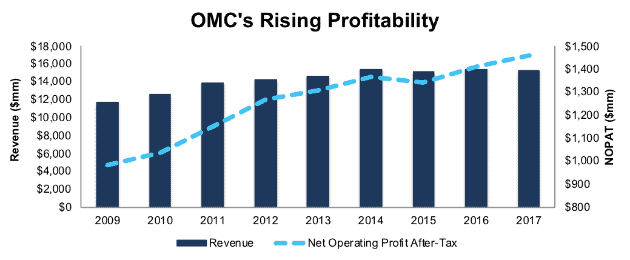
Sources: New Constructs, LLC and company filings
Free Cash Flow Supports Dividend Growth
Since 2013, OMC’s annual dividend has increased from $1.60/share to $2.25/share, or 9% compounded annually. The consistent dividend payment and growth has been supported by OMC’s strong free cash flow. Per Figure 2, OMC has generated nearly three times as much free cash flow as it has paid in dividends: cumulative $7.4 billion (42% of market cap) in FCF and cumulative dividends of $2.8 billion since 2013.
Companies with strong free cash flow provide higher quality dividend yields because we know the firm has the cash to support its dividend. On the flip side, dividends from companies with low or negative free cash flow cannot be trusted as much because the company may not be able to sustain paying dividends.
Figure 2: OMC’s FCF vs. Dividends Since 2013
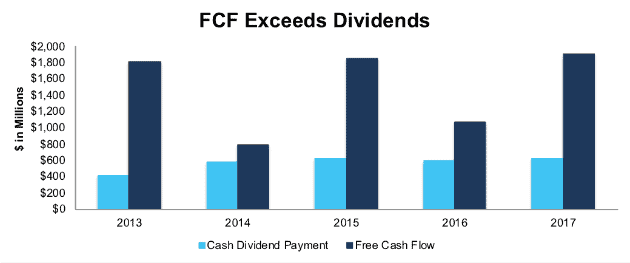
Sources: New Constructs, LLC and company filings
OMC Remains Undervalued
At its current price of $77/share, OMC has a price-to-economic book value (PEBV) ratio of 0.8. This ratio means the market expects OMC’s NOPAT to permanently decline by 20%. This expectation seems rather pessimistic for a firm that has grown NOPAT by 5% compounded annually since 2009 and 7% compounded annually since 1998.
If OMC can maintain 2017 NOPAT margins (10%) and grow NOPAT by just 4% compounded annually for the next decade, the stock is worth $127/share today – a 65% upside.
Auditable Impact of Footnotes & Forensic Accounting Adjustments
Our Robo-Analyst technology enables us to perform forensic accounting with scale and provide the research needed to fulfill fiduciary duties. In order to derive the true recurring cash flows, an accurate invested capital, and a real shareholder value, we made the following adjustments to Omnicom’s 2017 10-K:
Income Statement: we made $481 million of adjustments with a net effect of removing $375 million in non-operating expense (2% of revenue). We removed $428 million related to non-operating expenses and $53 million related to non-operating income. See all adjustments made to OMC’s income statement here.
Balance Sheet: we made $7.1 billion of adjustments to calculate invested capital with a net increase of $786 million. The most notable adjustment was $1.4 billion (14% of reported net assets) related to operating leases. See all adjustments to OMC’s balance sheet here.
Valuation: we made $11.1 billion of adjustments with a net effect of decreasing shareholder value by $5 billion. Apart from total debt, which includes the $1.4 billion in operating leases noted above, the largest adjustment to shareholder value was $3 billion in excess cash. This adjustment represents 17% of OMC’s market value. Despite the net decrease in shareholder value, OMC remains undervalued.
This article originally published on February 27, 2018.
Disclosure: David Trainer, Kyle Guske II, and Sam McBride receive no compensation to write about any specific stock, style, or theme.
Follow us on Twitter, Facebook, LinkedIn, and StockTwits for real-time alerts on all our research.
[1] Ernst & Young’s recent white paper “Getting ROIC Right” proves the superiority of our holdings research and analytics.
Click here to download a PDF of this report.
Photo Credit: wonderwebby (Flickr)