
This report highlights last month’s top performers and features a stock from the current portfolio. July’s Dividend Growth Stocks Model Portfolio was made available to members on July 27, 2018.
Recap from June’s Picks
Our Dividend Growth Stocks Model Portfolio underperformed the S&P 500 last month. The Model Portfolio rose 3.3% on a price return basis and 3.5% on a total return basis. The S&P 500 rose 5.4% on a price return and total return basis. The portfolio’s best performing stock was Ituran Location and Control Ltd. (ITRN), which was up 16%. Overall, seven out of the 30 Dividend Growth Stocks outperformed the S&P last month, and 26 had positive returns.
The long-term success of our model portfolio strategies highlights the value of our Robo-Analyst technology[1], which scales our forensic accounting expertise (featured in Barron’s) across thousands of stocks[2].
The methodology for this model portfolio mimics an All-Cap Blend style with a focus on dividend growth. Selected stocks earn an Attractive or Very Attractive rating, generate positive free cash flow (FCF) and economic earnings, offer a current dividend yield >1%, and have a 5+ year track record of consecutive dividend growth. This model portfolio is designed for investors who are more focused on long-term capital appreciation than current income, but still appreciate the power of dividends, especially growing dividends.
Featured Stock from July: Best Buy Co. (BBY: $74/share)
Best Buy Co. (BBY), a consumer electronics retailer, is the featured stock from July’s Dividend Growth Stocks Model Portfolio. BBY was also a featured Long Idea in April 2018 and is currently in our Focus List – Long Model Portfolio.
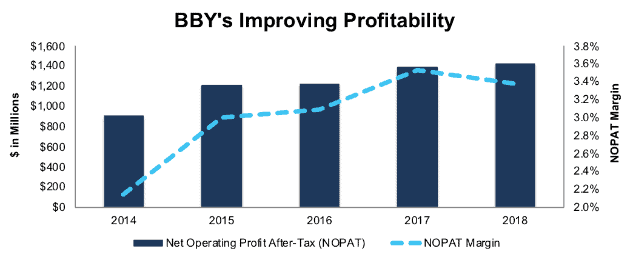
Since fiscal 2014, BBY has grown after-tax operating profit (NOPAT) by 12% compounded annually. BBY’s NOPAT margin has improved from 2.1% in fiscal 2014 to 3.4% in fiscal 2018 while its return on invested capital (ROIC) improved from 7% to 15%.
Figure 1: BBY’s NOPAT and Margin Since Fiscal 2014
Sources: New Constructs, LLC and company filings
Steady Dividend Growth Supported by FCF
Best Buy has increased its annual dividend in each of the last five years and eight times within the last decade. BBY’s annual dividend has grown from $0.68/share in fiscal 2014 to $1.36/share in fiscal 2018, or 19% compounded annually. The current dividend equates to a 2.4% dividend yield. Best of all, Best Buy generates the necessary cash flow to continue paying its dividend. Over the past five years, BBY has generated a cumulative $12.5 billion (61% of market cap) in free cash flow while paying $1.9 billion in dividends.
Companies with FCF well in excess of dividend payments provide higher quality dividend growth opportunities because we know the firm generates the cash to support the current dividend as well as a higher dividend. On the flip side, the dividend growth trajectory of a company where FCF falls short of the dividend payment over time cannot be trusted to grow or sustain its dividend because of inadequate free cash flow.
BBY Provides Significant Upside Potential
As we noted in our Long Idea, BBY is well positioned to excel in a hypothetical Amazon-dominated retail world yet the stock is priced as if the company has no potential for future growth. This disconnect leaves shares significantly undervalued. At its current of $74/share, BBY has a price-to-economic book value (PEBV) ratio of 1.0 This ratio means the market expects BBY’s NOPAT to remain flat and never grow from current levels. This expectation seems overly pessimistic for a firm that has grown NOPAT by 12% compounded annually since 1998.
If BBY maintains current margins (3%) and grows NOPAT by just 3% compounded annually over the next decade, the stock is worth $89/share today – a 20% upside. See the math behind this dynamic DCF scenario. Add in Best Buy’s 2.4% dividend yield and history of dividend growth, and it’s clear why this stock is in July’s Dividend Growth Stocks Model Portfolio.
Critical Details Found in Financial Filings By Our Robo-Analyst Technology
As investors focus more on fundamental research, research automation technology is needed to analyze all the critical financial details in financial filings. Below are specifics on the adjustments we make based on Robo-Analyst findings in Best Buy’s 2018 10-K:
Income Statement: we made $523 million of adjustments, with a net effect of removing $423 million in non-operating expense (1% of revenue). We removed $50 million in non-operating income and $473 million in non-operating expenses. You can see all the adjustments made to BBY’s income statement here.
Balance Sheet: we made $7.2 billion of adjustments to calculate invested capital with a net increase of $4 billion. The most notable adjustment was $2.6 billion in operating leases. This adjustment represented 50% of reported net assets. You can see all the adjustments made to BBY’s balance sheet here.
Valuation: we made $4.6 billion of adjustments with a net effect of decreasing shareholder value by $3.5 billion. Apart from $4 billion in total debt, which includes the $2.6 billion in operating leases noted above, the largest adjustment to shareholder value was $496 million in excess cash. This cash adjustment represents 2% of BBY’s market cap. Despite the decrease in shareholder value, BBY remains undervalued.
This article originally published on August 1, 2018.
Disclosure: David Trainer, Kyle Guske II, and Sam McBride receive no compensation to write about any specific stock, style, or theme.
Follow us on Twitter, Facebook, LinkedIn, and StockTwits for real-time alerts on all our research.
[1] Harvard Business School features the powerful impact of our research automation technology in the case New Constructs: Disrupting Fundamental Analysis with Robo-Analysts.
[2] Ernst & Young’s recent white paper “Getting ROIC Right” proves the superiority of our holdings research and analytics.