
Recap from May’s Picks
Our Most Attractive Stocks (+3.9%) underperformed the S&P 500 (+4.5%) last month. Most Attractive Large Cap stock Micron Technology (MU) gained 27%. Most Attractive Small Cap stock G-III Apparel Group (GIII) was up 22%. Overall, 18 out of the 40 Most Attractive stocks outperformed the S&P 500 in May.
Our Most Dangerous Stocks (+7.3%) underperformed the S&P 500 (+4.5%) as a short portfolio last month. Most Dangerous Large Cap stock Dish Network (DISH) fell by 12% and Most Dangerous Small Cap Stock Innovative Solutions and Support (ISCC) fell by 15%. Overall, 16 out of the 40 Most Dangerous stocks outperformed the S&P 500 as shorts in May.
The successes of these model portfolios highlight the value of our machine learning and AI Robo-Analyst technology[1], which helps clients fulfill the fiduciary duty of care and make smarter investments[2].
18 new stocks make our Most Attractive list this month and 25 new stocks fall onto the Most Dangerous list this month. June’s Most Attractive and Most Dangerous stocks were made available to members on June 6, 2018.
Our Most Attractive stocks have high and rising returns on invested capital (ROIC) and low price to economic book value ratios. Most Dangerous stocks have misleading earnings and long growth appreciation periods implied by their market valuations.
Most Attractive Stocks Feature for June: Stepan Company (SCL: $75/share)
Stepan Company (SCL), a specialty and intermediate chemical manufacturer, is the featured stock from June’s Most Attractive Stocks Model Portfolio.
Since 2007, SCL has grown after-tax profit (NOPAT) by 15% compounded annually, to $124 million in 2017. NOPAT has increased to $151 million over the last twelve months (TTM). The company’s NOPAT margin has increased from 2% in 2007 to 8% TTM while its return on invested capital (ROIC) has improved from 7% to 13%.
Figure 1: SCL’s Revenue & NOPAT Since 2007
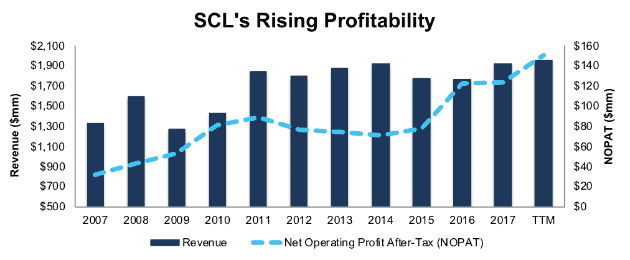
Sources: New Constructs, LLC and company filings
SCL Valuation Provides Upside
Despite the consistent improvement in fundamentals, SCL is up only 36% over the past five years while the market (S&P 500) is up 75%. More recently, SCL is down 15% over the past year and the stock is undervalued. At its current price of $75/share, SCL has a price-to-economic book value (PEBV) ratio of 0.8. This ratio means the market expects SCL’s NOPAT to permanently fall by 20%. This expectation seems rather pessimistic for a company that has grown NOPAT by 15% compounded annually over the past decade.
If SCL can simply maintain current margins (8%) and grow NOPAT by just 5% compounded annually for the next decade, the stock is worth $100/share today – a 33% upside. See the math behind this dynamic DCF scenario here.
Critical Details Found in Financial Filings By Our Robo-Analyst Technology
As investors focus more on fundamental research, research automation technology is needed to analyze all the critical financial details in financial filings. Below are specifics on the adjustments we make based on Robo-Analyst findings in Stepan Company’s 2017 10-K:
Income Statement: we made $78 million of adjustments, with a net effect of removing $32 million in non-operating expense (2% of revenue). We removed $23 million in non-operating income and $55 million in non-operating expenses. You can see all the adjustments made to SCL’s income statement here.
Balance Sheet: we made $454 million of adjustments to calculate invested capital with a net decrease of $28 million. One of the largest adjustments was adding back $100 million in other comprehensive loss. This adjustment represented 9% of reported net assets. You can see all the adjustments made to SCL’s balance sheet here.
Valuation: we made $556 million of adjustments with a net effect of decreasing shareholder value by $209 million. The largest adjustment to shareholder value was $174 million in excess cash. This adjustment represents 10% of SCL’s market cap. Despite the decrease in shareholder value, SCL remains undervalued.
Most Dangerous Stocks Feature: Park Electrochemical Corp (PKE: $21/share)
Park Electrochemical Corp (PKE), digital and radio frequency/microwave printed circuit material manufacturer, is the featured stock from June’s Most Dangerous Stocks Model Portfolio.
Since 2011, PKE’s revenue has fallen 9% compounded annually while its NOPAT fell 19% compounded annually. PKE’s NOPAT margin has declined from 16% in 2011 to 7% TTM and its ROIC fell from 20% 5% over the same time.
Figure 2: PKE’s NOPAT Since 2011
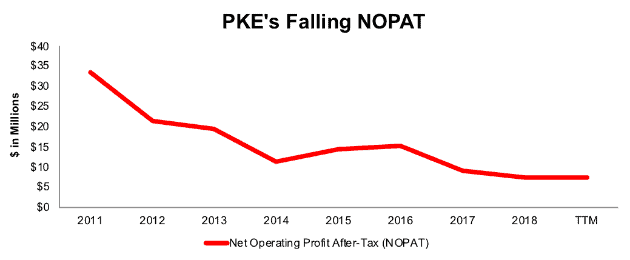
Sources: New Constructs, LLC and company filings
PKE Provides Poor Risk/Reward Tradeoff
Despite the declining fundamentals, PKE is still up 22% over the past two years. This price appreciation makes PKE significantly overvalued, and the expectations baked into the stock price simply cannot be justified by the fundamentals of the business.
To justify its current price of $21/share, PKE must maintain TTM margins (7%) and grow NOPAT by 10% compounded annually for the next 11 years. This expectation seems rather optimistic considering PKE’s NOPAT and margins have fallen significantly over the past few years. See the math behind this dynamic DCF scenario here.
Even if we assume PKE can maintain TTM margins and grow NOPAT by a more reasonable (but still optimistic) 6% compounded annually for the next decade, the stock is worth just $15/share today – a 29% downside. See the math behind this dynamic DCF scenario here.
Critical Details Found in Financial Filings By Our Robo-Analyst Technology
As investors focus more on fundamental research, research automation technology is needed to analyze all the critical financial details in financial filings. Below are specifics on the adjustments we make based on Robo-Analyst findings in Park Electrochemical’s 2018 10-K:
Income Statement: we made $33 million of adjustments, with a net effect of removing $13 million in non-operating income (12% of revenue). We removed $23 million in non-operating income and $10 million in non-operating expenses. You can see all the adjustments made to PKE’s income statement here.
Balance Sheet: we made $193 million of adjustments to calculate invested capital with a net decrease of $17 million. One of the largest adjustments was $75 million due to asset write-downs. This adjustment represented 48% of reported net assets. You can see all the adjustments made to PKE’s balance sheet here.
Valuation: we made $110 million of adjustments with a net effect of increasing shareholder value by $96 million. The largest adjustment to shareholder value was $103 million in excess cash. This adjustment represents 25% of PKE’s market cap.
This article originally published on June 13, 2018.
Disclosure: David Trainer, Kyle Guske II, and Sam McBride receive no compensation to write about any specific stock, style, or theme.
Follow us on Twitter, Facebook, LinkedIn, and StockTwits for real-time alerts on all our research.
[1] Harvard Business School features the powerful impact of our research automation technology in the case New Constructs: Disrupting Fundamental Analysis with Robo-Analysts.
[2] Ernst & Young’s recent white paper “Getting ROIC Right” proves the superiority of our holdings research and analytics.