Seven new stocks make our Safest Dividend Yield Model Portfolio this month, which was made available to members on November 22, 2017.
Recap from October’s Picks
Our Safest Dividend Yields Model Portfolio outperformed the S&P 500 last month. The Model Portfolio rose 1.3% on a price return basis and rose 1.5% on a total return basis. The S&P 500 rose 0.5% on both a price return and total return basis. The best performing stocks in the portfolio were large cap stock TELUS Corporation (TU), which was up 7%, and small cap stock, TransAct Technologies (TACT), which was up 68%. Overall, six out of the 20 Safest Dividend Yield stocks outperformed the S&P in October.
This Model Portfolio leverages our Robo-Analyst technology, which scales our forensic accounting expertise (featured in Barron’s) across thousands of stocks.[1]
This Model Portfolio only includes stocks that earn an Attractive or Very Attractive rating, have positive free cash flow and economic earnings, and offer a dividend yield greater than 3%. Companies with strong free cash flow provide higher quality and safer dividend yields because we know they have the cash to support the dividend. We think this portfolio provides a uniquely well-screened group of stocks that can help clients outperform.
Featured Stock for November: National Presto Industries (NPK: $117/share)
National Presto Industries, a small appliance and defense products manufacturer, is the featured stock in November’s Safest Dividend Yield Model Portfolio. NPK is also on November’s Most Attractive Stocks List as well.
Since 2014, NPK has grown after-tax profit (NOPAT) by 21% compounded annually. NOPAT margin has increased from 7% in 2014 to 15% TTM while return on invested capital (ROIC) has improved from 9% in 2014 to a top-quintile 16% TTM.
Figure 1: NPK’s NOPAT and Margin Improvement
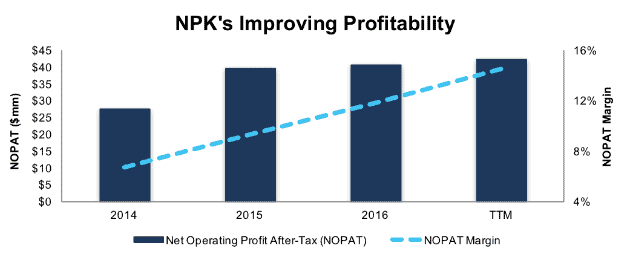
Sources: New Constructs, LLC and company filings
Free Cash Flow Supports Dividend Payments
NPK’s regular annual dividend has been maintained at $1/share for each of the past five years. Over this time, the company has paid special dividends ranging from $3.05/share to $5/share. The continued payment of regular and special dividends is supported by NPK’s strong free cash flow. Per Figure 2, NPK has generated cumulative FCF of $195 million (24% of market cap) and paid out cumulative dividends of $98 million since 2014.
Companies with strong free cash flow provide higher quality dividend yields because we know the firm has the cash to support its dividend. On the flip side, dividends from companies with low or negative free cash flow cannot be trusted as much because the company may not be able to sustain paying dividends.
Figure 2: NPK’s FCF vs Dividends Since 2014
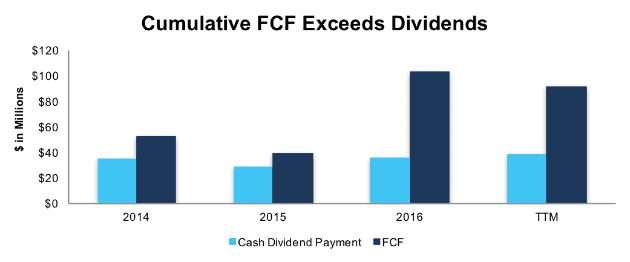
Sources: New Constructs, LLC and company filings
Current Valuation Provides Significant Upside Potential
Despite outperforming the market over the past two years (up 35% versus S&P 500 up 24%), NPK remains undervalued. At its current price of $117/share, NPK has a price-to-economic book value (PEBV) ratio of 1.0. This ratio means the market expects NPK’s NOPAT to never grow from its current levels. This expectation seems rather pessimistic given the company’s 5% compounded annual NOPAT growth over the past decade.
If NPK can maintain TTM NOPAT margins (15%) and grow NOPAT by just 5% compounded annually for the next decade, the stock is worth $168/share today – a 44% upside.
Auditable Impact of Footnotes & Forensic Accounting Adjustments
Our Robo-Analyst technology enables us to perform forensic accounting with scale and provide the research needed to fulfill fiduciary duties. In order to derive the true recurring cash flows, an accurate invested capital, and a real shareholder value, we made the following adjustments to National Presto’s 2016 10-K:
Income Statement: we made $6 million of adjustments with a net effect of removing $4 million in non-operating income (1% of revenue). We removed $1 million related to non-operating expenses and $5 million related to non-operating income. See all adjustments made to NPK’s income statement here.
Balance Sheet: we made $211 million of adjustments to calculate invested capital with a net decrease of $96 million. The most notable adjustment was $65 million (18% of reported net assets) related to discontinued operations. See all adjustments to NPK’s balance sheet here.
Valuation: we made $118 million of adjustments with a net effect of increasing shareholder value by $116 million. The largest adjustment to shareholder value was $113 million in excess cash. This adjustment represents 14% of NPK’s market value.
This article originally published on November 28, 2017.
Disclosure: David Trainer, Kyle Guske II, and Sam McBride receive no compensation to write about any specific stock, style, or theme.
Follow us on Twitter, Facebook, LinkedIn, and StockTwits for real-time alerts on all our research.
[1] Ernst & Young’s recent white paper “Getting ROIC Right” proves the superiority of our holdings research and analytics.
Click here to download a PDF of this report.