
In today’s market, which is increasingly defined by elevated valuations and heightened volatility, it’s hard for many investors to find reliable opportunities that balance risk and return. Quality dividend stocks stand out as a compelling choice in this environment.
What makes a quality dividend stock?
First, we explained in detail what makes a bad dividend stock in this special training on:
- Fake Dividend Stocks
- False Dividend Stocks
- Dividend-Trap Stocks
For good dividend stocks, the most important attribute is a company’s ability to generate consistent cash flows, which demonstrates the financial resilience needed to sustain dividend payouts.
Our Dividend Growth Stocks Model Portfolio offers even more. It includes stocks that get an Attractive-or-better rating and companies that not only produce ample free cash flow to support their dividend payments, but also consistently increase their dividend payments over time.
Below is an overview of one of the stocks from the August edition of our Dividend Growth Model Portfolio. It is not an in-depth Long Idea report, but it will give you a good understanding of how our research combines fundamental research with expectations investing. It’s rare we find a dividend stock this good. Out of the 3,300+ stocks we cover, only about 25 stocks qualify for this Model Portfolio.
We hope you enjoy this free stock pick. Feel free to share this report with friends and colleagues.
We update this Model Portfolio monthly. August’s Dividend Growth Model Portfolio was updated and published for clients on August 29, 2025.
Free Stock Pick: Allison Transmission (ALSN: $89/share)
Allison Transmission grew revenue and net operating profit after-tax (NOPAT) by 4% and 9% compounded annually, respectively, since 2014. The company’s NOPAT margin improved from 15% in 2014 to 25% in the trailing-twelve-months (TTM), while invested capital turns improved from 0.5 to 0.8 over the same time. Rising NOPAT margin and invested capital turns drives return on invested capital (ROIC) from 8% in 2014 to 19% over the TTM.
Figure 1: Allison Transmission’s Revenue & NOPAT Since 2014
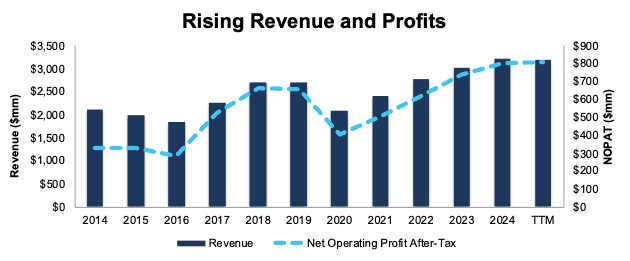
Sources: New Constructs, LLC and company filings
Free Cash Flow Exceeds Dividend Payments
Allison Transmission has increased its regular, quarterly dividend from $0.17/share in 3Q20 to $0.27/share in 3Q25. The quarterly dividend, when annualized, equals $1.08/share and provides a 1.2% dividend yield.
More importantly, Allison Transmission’s cumulative free cash flow (FCF) easily exceeds its dividend payments. From 2020 through the first half of 2025, Allison Transmission generated $3.2 billion (33% of current enterprise value) in FCF while paying over $455 million in dividends. See Figure 2.
Figure 2: Allison Transmission’s FCF vs. Dividends Since 2020
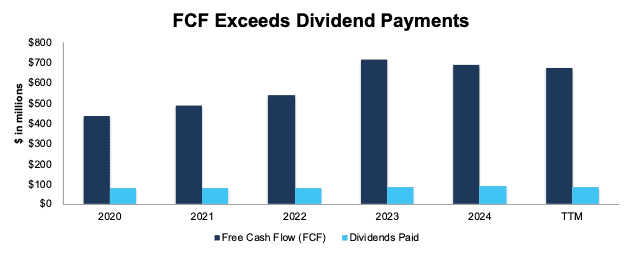
Sources: New Constructs, LLC and company filings
Companies with FCF well above dividend payments provide higher-quality dividend growth opportunities. On the other hand, dividends that exceed FCF cannot be trusted to grow or even be maintained.
ALSN Is Undervalued
At its current price of $89/share, ALSN has a price-to-economic book value (PEBV) ratio of 0.9. This ratio means the market expects Allison Transmission’s NOPAT to permanently fall 10% from TTM levels. This expectation seems overly pessimistic given that Allison Transmission has grown NOPAT by 4% compounded annually over the last five years and 9% compounded annually over the last ten years.
Even if Allison Transmission’s:
- NOPAT margin falls to 22% (equal to five-year average and below TTM NOPAT margin of 25%) through 2034,
- revenue grows at 2% compounded annually (below ten-year CAGR of 4%) through 2034, then
the stock would be worth $110/share today – a 24% upside. In this scenario, Allison Transmission’s NOPAT would grow just 1% compounded annually through 2024. Contact us for the math behind this reverse DCF scenario.
Add in Allison Transmission’s 1.2% dividend yield and a history of dividend growth, and it’s clear why this stock is in August’s Dividend Growth Stocks Model Portfolio.
Critical Details Found in Financial Filings by Our Robo-Analyst Technology
Below are specifics on the adjustments we make based on Robo-Analyst findings in Allison Transmissions 10-Ks and 10-Qs:
Income Statement: we made nearly $150 million in adjustments with a net effect of removing around $70 million in non-operating expense. Clients can see all adjustments made to the income statement on the GAAP Reconciliation tab on the Ratings page on our website.
Balance Sheet: we made over $2 billion in adjustments to calculate invested capital with a net decrease of over $600 million. The most notable adjustment was for deferred tax assets. See all adjustments made to the balance sheet on the GAAP Reconciliation tab on the Ratings page on our website.
Valuation: we made over $3.6 billion in adjustments with a net decrease to shareholder value of over $2.1 billion The most notable adjustment to shareholder value was total debt. See all adjustments to Allison Transmission’s valuation on the GAAP Reconciliation tab on the Ratings page on our website.
This article was originally published on September 5, 2025.
Disclosure: David Trainer, Kyle Guske II, and Hakan Salt receive no compensation to write about any specific stock, style, or theme.
Questions on this report or others? Join our online community and connect with us directly.