
The Stanley Cup Finals reward the most disciplined, resilient, and strategically sound team over a grueling season. One could make a similar argument about investing. In particular, dividend investing pays off for those who play the long game with patience and diligence.
While hockey fans watch teams battle shift by shift, seasoned investors know that building wealth through dividends is a long-term game of smart positioning, steady performance, and surviving market volatility.
If only dividend investing was always that easy. These days, more than ever, we see that not all dividend stocks are equal. There are fake dividend stocks, reviewed last week (replay here), that get our Very Unattractive rating due to significant downside risk, despite their appealing yield. These stocks often use dividends as a smokescreen to distract from weak financials and overvalued stock prices.
This week, we did a deep dive on False Dividend stocks. In this training, we warned investors about stocks that can’t afford to keep paying their dividends because their free cash flow is negative. Many stocks are borrowing and selling stock like crazy to keep up false appearances of being a dividend payor. Learn more about the stocks most likely to cut their dividends here.
Next Friday, June 13, we’ll turn our attention to a third type of bad dividend stocks – dividend-trap stocks. You can register for the training here. We’ll show you how exactly to identify and avoid these potential losers.
Finding great dividend stocks requires rigorous analysis and diligence. Same is true to uncovering the risky ones. Our Dividend Growth Model Portfolio features companies that not only produce ample free cash flow to support their dividend payments, but also have a strong track record of consistently increasing their dividend payments over time.
Below is an overview of one of the stocks from our Dividend Growth Model Portfolio. It is not an in-depth Long Idea report, but it will give you a good understanding of how our research combines fundamental research with expectations investing. It’s also a great example of a good dividend stock.
We hope you enjoy this free stock pick. Feel free to share this report with friends and colleagues.
We update this Model Portfolio monthly. May’s Dividend Growth Model Portfolio was updated and published for clients on May 29, 2025.
Free Stock Pick: Primerica Inc. (PRI: $268/share)
Primerica has grown revenue and net operating profit after-tax (NOPAT) by 9% and 17% compounded annually, respectively, since 2014. The company’s NOPAT margin increased from 14% in 2014 to 28% in the TTM, while invested capital turns rose from 0.9 to 1.0 over the same time. Rising NOPAT margins and invested capital turns drive return on invested capital (ROIC) from 12% in 2014 to 29% in the TTM.
Figure 1: Primerica’s Revenue & NOPAT Since 2014
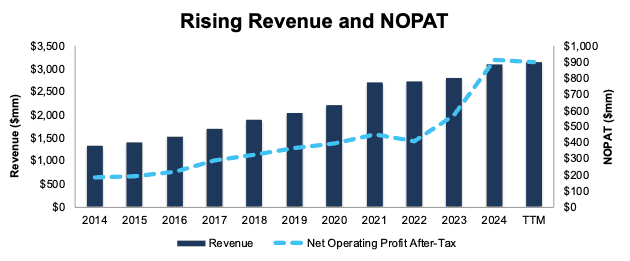
Sources: New Constructs, LLC and company filings
Free Cash Flow Exceeds Dividend Payments
Primerica has increased its regular, quarterly dividend from $0.34/share in 1Q19 to $1.04/share in 1Q25. The quarterly dividend, when annualized, equals $4.16/share and provides a 1.6% dividend yield.
More importantly, Primerica’s cumulative free cash flow (FCF) easily exceeds its dividend payments. From 2019 through 1Q25, Primerica generated $2.7 billion (31% of current enterprise value) in FCF while paying $522 million in dividends. See Figure 2.
Figure 2: Primerica’s FCF vs. Dividends Since 2019
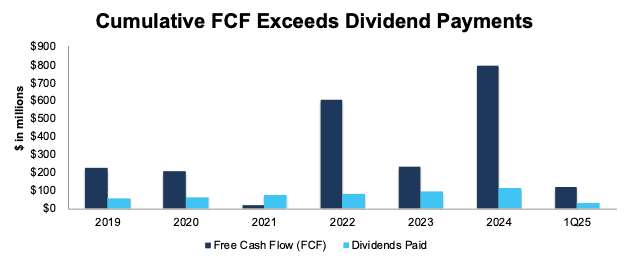
Sources: New Constructs, LLC and company filings
Companies with FCF well above dividend payments provide higher-quality dividend growth opportunities. On the other hand, dividends that exceed FCF cannot be trusted to grow or even be maintained.
PRI Is Undervalued
At its current price of $268/share, Primerica has a price-to-economic book value (PEBV) ratio of 0.8. This ratio means the market expects Primerica’s NOPAT to permanently fall 20% from current levels. This expectation seems overly pessimistic given that Primerica has grown NOPAT by 18% and 17% compounded annually over the past five and ten years, respectively.
Even if Primerica’s:
- NOPAT margin falls to 20% (equal to five-year average and below TTM margin of 28%) and
- revenue grows 6% compounded annually (below the 9% CAGR over the last five and ten years) for the next decade,
the stock would be worth $327/share today – a 22% upside. In this scenario, Primerica’s NOPAT would grow just 2% compounded annually through 2034. Contact us for the math behind this reverse DCF scenario.
Add in Primerica’s 1.6% dividend yield and a history of dividend growth, and it’s clear why this stock is in May’s Dividend Growth Stocks Model Portfolio.
Critical Details Found in Financial Filings by Our Robo-Analyst Technology
Below are specifics on the adjustments we make based on Robo-Analyst findings in Primerica’s 10-K and 10-Q:
Income Statement: we made just under $600 million in adjustments with a net effect of removing over $400 million in non-operating expense. Clients can see all adjustments made to Primerica’s income statement on the GAAP Reconciliation tab on the Ratings page on our website.
Balance Sheet: we made just under $1 billion in adjustments to calculate invested capital with a net increase of under $200 million. The most notable adjustment was for other comprehensive income. See all adjustments made to Primerica’s balance sheet on the GAAP Reconciliation tab on the Ratings page on our website.
Valuation: we made under $100 million in adjustments, all of which decreased shareholder value. The most notable adjustment to shareholder value was for total debt. See all adjustments to Primerica’s valuation on the GAAP Reconciliation tab on the Ratings page on our website.
This article was originally published on June 6, 2025.
Disclosure: David Trainer, Kyle Guske II, and Hakan Salt receive no compensation to write about any specific stock, style, or theme.
Questions on this report or others? Join our online community and connect with us directly.