
Earnings season is right around the corner, so we hope you’re ready for Wall Street propaganda to ramp up. We’re building an Earnings Predictor feature into the AI Agent we’re developing with Google Cloud so clients can know where the Wall Street propaganda might cost them the most money.
Without our Core Earnings and Earnings Distortion Scores, Earnings Season can be costly. Especially these days, when stock valuations remain stretched and the ongoing government shutdown hurts the economy.
Wondering where you can find safe harbor in this storm?
We believe companies that reward shareholders through consistent and growing dividends remain a beacon of stability, and a reminder that disciplined capital allocation never goes out of style.
Our Dividend Growth Stocks Model Portfolio includes stocks that get an Attractive-or-better rating and companies that not only produce ample free cash flow to support their dividend payments, but also consistently increase their dividend payments over time.
Below is an overview of one of the stocks from the latest edition of our Dividend Growth Model Portfolio. It is not an in-depth Long Idea report, but it will give you a good understanding of how our research combines fundamental research with expectations investing.
We hope you enjoy this free stock pick. Feel free to share this report with friends and colleagues.
We update this Model Portfolio monthly. September’s Dividend Growth Model Portfolio was updated and published for clients on September 30, 2025.
Free Stock Pick: Primerica Inc. (PRI: $270/share)
Primerica has grown revenue and net operating profit after-tax (NOPAT) by 8% and 16% compounded annually, respectively, since 2014. The company’s NOPAT margin improved from 14% in 2014 to 26% in the trailing-twelve-months (TTM), while invested capital turns improved from 0.9 to 1.0 over the same time. Rising NOPAT margin and invested capital turns drive return on invested capital (ROIC) from 12% in 2014 to 26% over the TTM.
Figure 1: Primerica’s Revenue & NOPAT Since 2014
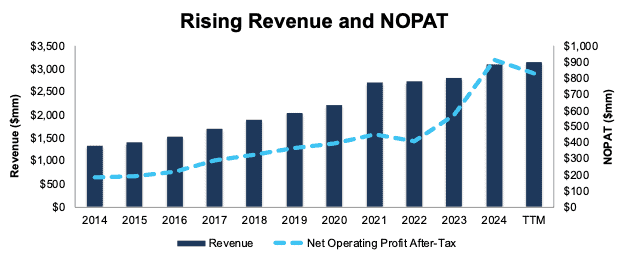
Sources: New Constructs, LLC and company filings
Free Cash Flow Exceeds Dividend Payments
Primerica has increased its regular, quarterly dividend from $0.34/share in 3Q19 to $1.04/share in 3Q25. The quarterly dividend, when annualized, equals $4.16/share and provides a 1.5% dividend yield.
More importantly, Primerica’s cumulative free cash flow (FCF) easily exceeds its dividend payments. From 2019 through the first half of 2025, Primerica generated $2.4 billion (28% of current enterprise value) in FCF while paying over $556 million in dividends. See Figure 2.
Figure 2: Primerica’s FCF vs. Dividends Since 2019
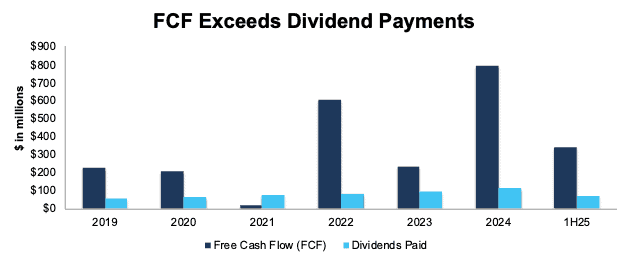
Sources: New Constructs, LLC and company filings
Companies with FCF well above dividend payments provide higher-quality dividend growth opportunities. On the other hand, dividends that exceed FCF cannot be trusted to grow or even be maintained.
PRI Is Undervalued
At its current price of $270/share, PRI has a price-to-economic book value (PEBV) ratio of 0.9. This ratio means the market expects Primerica’s NOPAT to permanently fall 10% from TTM levels. This expectation seems overly pessimistic given that Primerica has grown NOPAT by 16% compounded annually over the last five and ten years.
Even if Primerica’s:
- NOPAT margin falls to 20% (equal to five-year average and below TTM NOPAT margin of 26%) through 2034 and
- revenue grows at 6% compounded annually (equal to 2025 and 2026 consensus estimates, and below five- and ten-year CAGR of 8%) through 2034, then
the stock would be worth $325/share today – a 20% upside. In this scenario, Primerica’s NOPAT would grow just 2% compounded annually through 2034. Contact us for the math behind this reverse DCF scenario.
Add in Primerica’s 1.5% dividend yield and a history of dividend growth, and it’s clear why this stock is in September’s Dividend Growth Stocks Model Portfolio.
Critical Details Found in Financial Filings by Our Robo-Analyst Technology
Below are specifics on the adjustments we make based on Robo-Analyst findings in Primerica’s 10-Ks and 10-Qs:
Income Statement: we made nearly $600 million in adjustments with a net effect of removing over $400 million in non-operating expense. Clients can see all adjustments made to the income statement on the GAAP Reconciliation tab on the Ratings page on our website.
Balance Sheet: we made nearly $1 billion in adjustments to calculate invested capital with a net increase of over $150 million. The most notable adjustment was for other comprehensive income. See all adjustments made to the balance sheet on the GAAP Reconciliation tab on the Ratings page on our website.
Valuation: we made over $50 million in adjustments all of which decreased shareholder value. The most notable adjustment to shareholder value was total debt. See all adjustments to Primerica’s valuation on the GAAP Reconciliation tab on the Ratings page on our website.
This article was originally published on October 10, 2025.
Disclosure: David Trainer, Kyle Guske II, and Hakan Salt receive no compensation to write about any specific stock, style, or theme.
Questions on this report or others? Join our online community and connect with us directly.