
GameStop (GME) is back in the headlines, this time with a twist straight out of a crypto mixed meme paradise. The company announced plans to raise $1.75 billion through convertible notes to further support its Bitcoin investment strategy. Investors weren’t exactly thrilled as GME nosedived nearly 20% in a single day.
The wild world of hype and memes clearly isn’t going anywhere. But, beneath the buzz, there’s often a storm brewing. Differentiating between market noise and fundamental value is more critical than ever. In a market this noisy, disciplined, thorough research remains the most effective tool for avoiding costly missteps.
We created the Most Dangerous Stocks Model Portfolio to help investors steer clear of the danger in the stock market. This Model Portfolio highlights the worst of the worst, the stocks with poor fundamentals and excessive valuations, so you can avoid them with confidence.
If you, like us, prefer to avoid danger, then you’ll enjoy this free stock pick from our Most Dangerous Stocks Model Portfolio.
This free stock feature provides a summary of how we pick stocks for this Model Portfolio. It is not a full Danger Zone report, but it gives you insight into the rigor of our research and approach to picking stocks. Whether you’re a subscriber or not, we think it is important that you’re able to see our research on stocks on a regular basis.
We’re proud to share our work. Please feel free to share it with your friends and family.
Keep an eye out for the free pick from our Most Attractive Stocks Model Portfolio, which will be published this week as well! The work that goes into that report is just as valuable.
We update this Model Portfolio monthly. The latest Most Attractive and Most Dangerous stocks Model Portfolios were updated and published for clients on June 4, 2025.
Free Most Dangerous Stock Pick: Truist Financial Corp (TFC)
Truist’s (TFC: $40/share) net operating profit after tax (NOPAT) margin fell from 25% in 2019 to -2% in the TTM, while the company’s invested capital turns rose slightly from 0.3 to 0.4 over the same time. Falling NOPAT margins offset rising invested capital turns and drive Truist’s return on invested capital (ROIC) from 9% in 2019 to -1% in the TTM.
Truist’s economic earnings, the true cash flows of the business, fell from $663 million in 2019 to -$8.3 billion in the TTM. Meanwhile, the company’s GAAP net income rose from $3.0 billion to $4.5 billion over the same time. Whenever GAAP earnings rise while economic earnings decline, investors should beware.
Figure 1: Truist’s Economic vs GAAP Earnings Since 2019
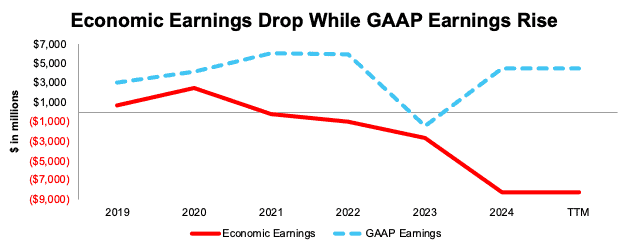
Sources: New Constructs, LLC and company filings
TFC Provides Poor Risk/Reward
Despite its poor and declining fundamentals, Truist’s stock is priced for significant profit growth, and we believe the stock is overvalued.
To justify its current price of $40/share, Truist must improve its NOPAT margin to 6% (compared to -2% in the TTM) and grow revenue by 12% compounded annually through 2034 (equal to the company’s ten-year CAGR). In this scenario, Truist’s implied NOPAT of $6.0 billion in 2034 would nearly equal the company’s second highest NOPAT achieved in 2022. Contact us for the math behind this reverse DCF scenario. We think these expectations are overly optimistic.
Even if Truist improves its NOPAT margin to 4% and grows revenue 12% compounded annually through 2034, the stock would be worth no more than $25/share today – a 38% downside to the current stock price. Contact us for the math behind this reverse DCF scenario.
Each of these scenarios also assumes Truist can grow revenue, NOPAT, and FCF without increasing working capital or fixed assets. This assumption is unlikely but allows us to create best case scenarios that demonstrate the high expectations embedded in the current valuation.
Critical Details Found in Financial Filings by Our Robo-Analyst Technology
Below are specifics on the adjustments we made based on Robo-Analyst findings in Truist’s 10-K and 10-Q:
Income Statement: we made over $7 billion in adjustments, with a net effect of removing over $5 billion in non-operating income. Professional members can see all adjustments made to the company’s income statement on the GAAP Reconciliation tab on the Ratings page on our website.
Balance Sheet: we made over $28 billion in adjustments to calculate invested capital with a net increase of just under $11 billion. One of the most notable adjustments was for other comprehensive income. Professional members can see all adjustments made to the company’s balance sheet on the GAAP Reconciliation tab on the Ratings page on our website.
Valuation: we made just under $14 billion in adjustments to shareholder value, with a net decrease of under $500 million. The most notable adjustment to shareholder value was for preferred stock. Professional members can see all adjustments to the company’s valuation on the GAAP Reconciliation tab on the Ratings page on our website.
This article was originally published on June 13, 2025.
Disclosure: David Trainer, Kyle Guske II, and Hakan Salt receive no compensation to write about any specific stock, style, or theme.
Questions on this report or others? Join our online community and connect with us directly.