
Investing in dividend-paying stocks in volatile markets is a proven strategy for generating income and preserving capital. However, successful execution of this strategy requires more than simply chasing the highest yields.
The key to successful dividend investing is not finding companies that pay dividends, it’s about finding companies that can actually afford to keep paying and grow them. Chasing high dividend yields from shaky companies is like building a house on quicksand – sooner or later, it’s going to sink.
You don’t want your “income stock” to tank and wipe out your gains or, worse, stop paying dividends altogether because the business is bleeding cash. The only way to avoid “false dividend” stocks is with diligent fundamental research on cash flows. As we’ve proven many times, investors have to do their homework to get the truth about cash flow.
Our Safest Dividend Yields Model Portfolio only includes companies that generates enough cash flows to support dividend payments. It also only includes stocks that get an Attractive or Very Attractive rating. In other words, we give you the best of both worlds: safety and upside potential.
Below you will find a free stock pick from the May edition of our Safest Dividend Yields Model Portfolio. This summary is not a full Long Idea report, but it will give you insight into the rigor of our research and approach to picking stocks.
Feel free to share this report with friends and colleagues.
We update this Model Portfolio monthly. May’s Safest Dividend Yields Model Portfolio was updated and published for clients on May 22, 2025.
Free Stock Pick: General Mills (GIS: $53/share)
General Mills (GIS) is the featured stock in May’s Safest Dividend Yields Model Portfolio.
General Mills has grown revenue and net operating profit after tax (NOPAT) by 1% and 3% compounded annually, respectively, since fiscal 2014. The company’s NOPAT margin improved from 12% in fiscal 2014 to 15% in the TTM, while invested capital turns fell from 0.8 to 0.6 over the same time. Rising margins are enough to offset falling IC turns and drive the company’s return on invested capital (ROIC) from 9.3% in fiscal 2014 to 9.5% in the TTM.
Figure 1: General Mills’ Revenue & NOPAT Since Fiscal 2014
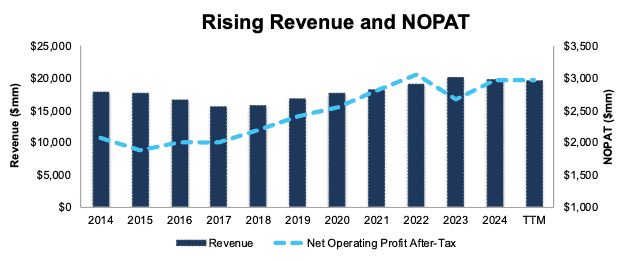
Sources: New Constructs, LLC and company filings
Free Cash Flow Exceeds Regular Dividend Payments
General Mills has increased its regular dividend from $0.49/share in fiscal 1Q19 to $0.60/share in fiscal 3Q25. The current quarterly dividend, when annualized provides a 4.5% dividend yield.
The company’s free cash flow (FCF) easily exceeds its regular dividend payments. From fiscal 2019 through fiscal 3Q25, the company generated $18.3 billion (40% of current enterprise value) in FCF while paying $8.5 billion in regular dividends. See Figure 2.
Figure 2: General Mills’ FCF Vs. Regular Dividends Since Fiscal 2019
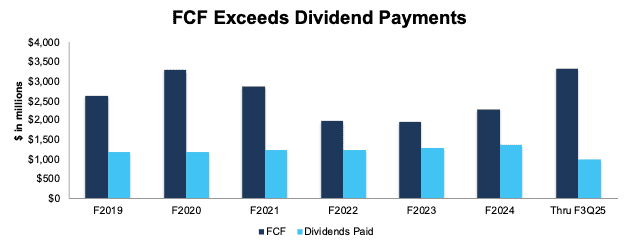
Sources: New Constructs, LLC and company filings
As Figure 2 shows, this company’s dividends are backed by a history of reliable cash flows. Dividends from companies with low or negative FCF are less dependable since the company might not be able to sustain paying dividends.
GIS Is Undervalued
At its current price of $53/share, GIS has a price-to-economic book value (PEBV) ratio of 0.8. This ratio means the market expects the company’s NOPAT to permanently fall 20% from TTM levels. This expectation seems overly pessimistic given that the company has grown NOPAT by 3% compounded annually over the last 10 years and 4% compounded annually over the last 20 years.
Even if the company’s:
- NOPAT margin immediately falls to 14.5% (still below five-year average and TTM NOPAT margin of 15%) through fiscal 2034,
- revenue grows at consensus rates in fiscal 2025 (-0.5%), fiscal 2026 (2.3%), and fiscal 2027 (1.2%), and
- revenue grows at fiscal 2027 consensus rate (1.2%) each year thereafter through fiscal 2034, then
the stock would be worth $70/share today – a 32% upside. In this scenario, the company’s NOPAT would grow <1% compounded annually through fiscal 2034. Contact us for the math behind this reverse DCF scenario.
Should the company’s NOPAT grow more in line with historical growth rates, the stock has even more upside.
Critical Details Found in Financial Filings by Our Robo-Analyst Technology
Below are specifics on the adjustments we make based on Robo-Analyst findings in this featured stock’s 10-K and 10-Qs:
Income Statement: we made over $1.1 billion in adjustments with a net effect of removing just under $500 million in non-operating expenses. Professional members can see all adjustments made to the company’s income statement on the GAAP Reconciliation tab on the Ratings page on our website.
Balance Sheet: we made over $8 billion in adjustments to calculate invested capital with a net increase of just under $7 billion. The most notable adjustment was for other comprehensive income. Professional members can see all adjustments made to the company’s balance sheet on the GAAP Reconciliation tab on the Ratings page on our website.
Valuation: we made over $17 billion in adjustments to shareholder value, with a net decrease of over $16 billion. Apart from total debt, the most notable adjustment to shareholder value was for deferred tax liabilities. Professional members can see all adjustments to the company’s valuation on the GAAP Reconciliation tab on the Ratings page on our website.
This article was originally published on May 30, 2025.
Disclosure: David Trainer, Kyle Guske II, and Hakan Salt receive no compensation to write about any specific stock, style, or theme.
Questions on this report or others? Join our online community and connect with us directly.