
A government shutdown, TrumpRx, and a presidential address that brought in nearly all high-ranking generals from around the world grabbed the headlines recently. These days, especially, no one knows what the story of the day will be, but prudent investors build their portfolio to withstand any headline.
For investors looking to avoid the volatility during these chaotic times, dividend investing can offer stability. But not all dividends are created equal. Across the market, firms with weak free cash flow, excessive leverage, or high payout ratios will find dividend sustainability tested when growth slows or cash flows dry up.
On the flip side, several companies continue to stand out as dividend safe havens, through their resilient business models, disciplined capital allocation, and strong cash flows to support the dividend.
Our Safest Dividend Yields Model Portfolio only includes companies that generate sufficient cash flows to support dividend payments and stocks that earn our Attractive or Very Attractive rating. In other words, the stocks in this Model Portfolio give you the best of both worlds: safety and upside potential.
Below you will find a free stock pick from the latest edition of our Safest Dividend Yields Model Portfolio. This summary is not a full Long Idea report, but it will give you insight into the rigor of our research and approach to picking stocks.
Feel free to share this report with friends and colleagues.
We update this Model Portfolio monthly. September’s Safest Dividend Yields Model Portfolio was updated and published for clients on September 23, 2025.
Free Stock Pick: Energizer Holdings (ENR: $25/share)
Energizer Holdings (ENR) is the featured stock in September’s Safest Dividend Yields Model Portfolio.
Energizer has grown revenue and net operating profit after tax (NOPAT) 4% and 5% compounded annually, respectively, since fiscal 2014. The company’s invested capital turns were flat at 0.7 from fiscal 2021 to the trailing-twelve-months (TTM), while its NOPAT margin improved from 14.1% to 14.5% over the same time. Rising margins drive the company’s return on invested capital (ROIC) from 9.4% in fiscal 2021 to 10.2% in the TTM.
Figure 1: Energizer’s Revenue & NOPAT Since Fiscal 2014
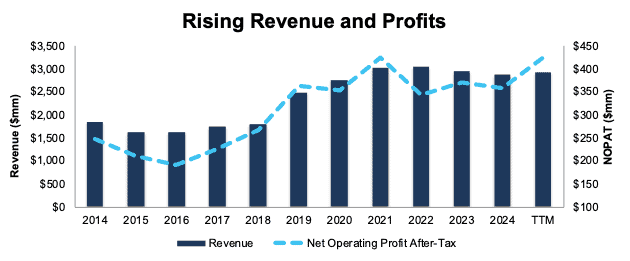
Sources: New Constructs, LLC and company filings
Free Cash Flow Exceeds Regular Dividend Payments
Energizer has maintained its regular dividend at $0.30/share since 4Q18. The current quarterly dividend, when annualized provides a 4.8% dividend yield.
The company’s free cash flow (FCF) easily exceeds its regular dividend payments. From 2021 through the first nine months of fiscal 2025, the company generated $2.4 billion (55% of current enterprise value) in FCF while paying $409 million in regular dividends. See Figure 2.
Figure 2: Energizer’s FCF Vs. Regular Dividends Since Fiscal 2021
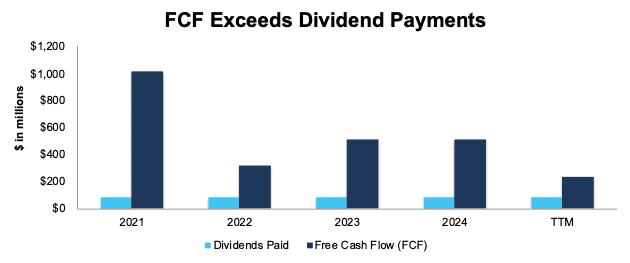
Sources: New Constructs, LLC and company filings
As Figure 2 shows, this company’s dividends are backed by a history of reliable cash flows. Dividends from companies with low or negative FCF are less dependable since the company might not have the cash to sustain paying dividends.
ENR Is Undervalued
At its current price of $25/share, ENR has a price-to-economic book value (PEBV) ratio of 0.4. This ratio means the market expects the company’s NOPAT to permanently fall 60% from TTM levels. This expectation seems overly pessimistic given that the company has grown NOPAT by 5% compounded annually since fiscal 2014 and 3% compounded annually since fiscal 2019.
Even if the company’s:
- NOPAT margin immediately falls to 9% (compared to 14.5% in the TTM and 5-yr average of 12.6%) through fiscal 2034, and
- revenue grows just 1% (below CAGR of 4% over the last decade) compounded annually through 2034, then
the stock would be worth $34/share today – a 36% upside. In this scenario, the company’s NOPAT would fall 2% compounded annually through 2034. Contact us for the math behind this reverse DCF scenario.
Should the company’s NOPAT grow more in line with recent growth rates, the stock has even more upside.
Critical Details Found in Financial Filings by Our Robo-Analyst Technology
Below are specifics on the adjustments we make based on Robo-Analyst findings in this featured stock’s 10-K and 10-Qs:
Income Statement: we made over $500 million in adjustments with a net effect of removing just over $300 million in non-operating expenses. Professional members can see all adjustments made to the company’s income statement on the GAAP Reconciliation tab on the Ratings page on our website.
Balance Sheet: we made over $1.0 billion in adjustments to calculate invested capital with a net increase of over $600 million. One of the most notable adjustments was for asset write downs. Professional members can see all adjustments made to the company’s balance sheet on the GAAP Reconciliation tab on the Ratings page on our website.
Valuation: we made over $2.6 billion in adjustments with a net decrease in shareholder value of ~$2.6 billion. Apart from total debt, the most notable adjustment to shareholder value was for pensions. Professional members can see all adjustments to the company’s valuation on the GAAP Reconciliation tab on the Ratings page on our website.
This article was originally published on October 3, 2025.
Disclosure: David Trainer, Kyle Guske II, and Hakan Salt receive no compensation to write about any specific stock, style, or theme.
Questions on this report or others? Join our online community and connect with us directly.