
For the best financial analysis ratios, look no further. Harvard Business School and MIT Sloan empirically demonstrate the superiority of the data that drives our models and calculations. This paper compares our financial analysis to Bloomberg and Capital IQ (see appendix for details).
We recently warned investors about the upcoming accounting rule change that will force companies to recognize operating leases on the balance sheet. In particular, we focused on how this rule change would impact metrics such as return on assets.
We did not discuss the impact on debt to equity because popular retail sites such as GuruFocus and Zacks do not always include leases as a part of debt.
However, we believe that the institutional financial data providers (i.e. CompuStat, Bloomberg and FactSet) will classify operating leases as debt. Millions of professional investors that rely on these services for data will see over $3 trillion in new debt added to corporate balance sheets. $3 trillion is a big number that will affect some stocks and sectors much more than others. We’re updating our analysis of the impact of bringing operating leases on balance sheet to include the impact of this rule change on debt to equity ratios.
What’s Changing?
First, a quick recap from our original piece about what’s changing with the new operating lease rule. Currently, a company can lease assets in one of two ways: capital leases or operating leases.
Capital leases are captured on balance sheets as the liability that funds the asset being leased. A simple analogy is a loan to purchase a car; payments are made contractually and, at the end of the term, the asset is owned outright.
Today, operating leases are not captured on balance sheets. Due to slight differences in operating vs capital lease contracts, there is no official transfer of ownership. The problem is that the underlying economic activity for two companies can be exactly the same while their balance sheets are radically different because one can use operating leases while the other uses capital leases.
This misleading accounting construct has become such a problem that Sir David Tweedie, the former Chairman of the International Accounting Standards Board, gave a speech in 2008 where he said:
“One of my great ambitions before I die is to fly in an aircraft that is on an airline’s balance sheet.”
Sir David will get his wish. Two years ago, the Financial Accounting Standards Board (FASB) – which governs U.S. GAAP rules – required companies to account for operating lease commitments, and the corresponding right of use asset, on the balance sheet. For more details on this new rule and how we plan to deal with it, read our article “The Impacts of Operating Leases Moving to the Balance Sheet.”
Stocks Impacted the Most?
Figure 1 shows the five S&P 500 companies whose debt to equity will be impacted most by this new rule.
Figure 1: Companies with the Most Operating Leases as a % of Shareholder’s Equity
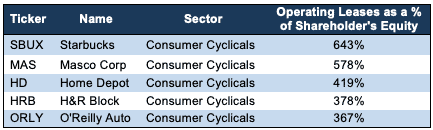
Sources: New Constructs, LLC and company filings
Starbucks (SBUX) will be the most heavily impacted, as its $7.5 billion in operating leases represent 643% of shareholder’s equity. Unsurprisingly, all five companies are in the Consumer Cyclicals sector. The Consumer Cyclicals sector will be the hardest hit by the new rule since most retailers lease their brick and mortar stores.
Other sectors where investors should look for the new accounting rule to affect balance sheets most are Consumer Non-Cyclicals, Real Estate, Telecom, and Industrials (especially airlines, per the quote above).
The Impact on Investors
Figure 2 shows the five companies out of the ~2,800 companies we cover that will be most impacted by the new rule and that currently have below average[1] debt to equity ratios. These companies will all go from looking attractive based on their debt to equity ratio to looking dangerous.
Figure 2: Companies Whose Changes in Debt to Equity Ratios Could Spook Investors
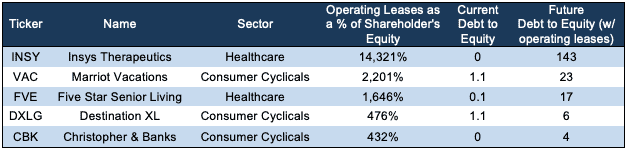
Sources: New Constructs, LLC and company filings
Such large changes and such high levels of debt to equity could easily spook both quants and any other investor who does not have a model like ours to tell him/her the change comes entirely from accounting rule changes.
Five Star Senior Living (FVE), for example, might currently look like an appealing deep value investment. The stock is down over 75% year to date, and the low debt to equity of 0.08 makes it seem as if the risk of bankruptcy is low.
However, FVE’s reported debt to equity ignores the vast majority of its debt. FVE’s reported debt comes from an $8 million mortgage on just one senior living community, but the company has 188 senior living communities that it finances with operating leases. These off-balance sheet leases have a present value of ~$1.6 billion and expire between 2024 and 2032.
If you don’t account for the off-balance sheet leases, FVE appears undervalued. The company currently has a price to accounting book value of 0.2, so it seems as if the stock should have upside in a liquidation.
However, the company’s operating leases make a potential liquidation much more difficult. These long-term leases make it much more difficult for the company to close unprofitable communities. As a result, FVE continues to operate at a loss and destroy value for shareholders year after year. Since 2013, the company’s book value per share has declined from $6.38 to just $1.88, a 70% decline. This kind of deterioration in book value is just another example of how price to book misleads investors.
If we look at FVE through the lens of operating cash flows and take into account its lease commitments, the expectations in its stock price, i.e. its valuation, start to look much more imposing. To justify its current valuation of $0.35/share, FVE must achieve pre-tax margins of 7% and grow revenue by 7% compounded annually for the next seven years. Both the revenue and margin assumptions are based on FVE’s operating performance in 2013, its most profitable year out of the past five years. Last year’s revenue growth and pre-tax margins were 1% and 4% respectively. See the math behind this dynamic DCF scenario.
FVE’s current debt to equity makes the stock look cheap and safe. Once its operating leases come onto the balance sheet, though, the debt to equity ratio will reflect the real risk in the stock. Sophisticated investors already understand this risk (there’s a reason the stock is down 75% ytd), but some quant funds and retail investors that hold FVE may be in for a rude awakening next year.
No single ratio can tell the whole story of a company, especially when that number is as flawed as debt to equity. Investors deserve and should seek more sophisticated metrics and analysis that provide a truer measure of value.
Value investing is not dead as long as you have access to research that can handle the growing complexity and volume of today’s accounting disclosures.
This article originally published on December 13, 2018.
Disclosure: David Trainer, Kyle Guske II, and Sam McBride receive no compensation to write about any specific stock, style, or theme.
Follow us on Twitter, Facebook, LinkedIn, and StockTwits for real-time alerts on all our research.
[1] The average debt to equity ratio for the S&P 500 is 1.45