
For the best financial analysis ratios, look no further. Harvard Business School and MIT Sloan empirically demonstrate the superiority of the data that drives our models and calculations. This paper compares our financial analysis to Bloomberg and Capital IQ (see appendix for details).
In recent Danger Zone reports, we’ve highlighted how P/E ratios and return on equity (ROE) mislead investors. This week, we’re looking at another metric that leads would-be value investors astray.
Price to book (P/B) is one of the oldest metrics in the value investing handbook, and it remains one of the most widely used today. FTSE Russell, one of the largest index providers in the world, uses P/B as its primary metric for distinguishing value stocks from growth stocks. Unfortunately, changes in accounting rules and the types of assets that create value for companies have made P/B a poor measure of value. Investors that still rely on P/B (including anyone in a value index fund) are in the Danger Zone.
No Correlation Between P/B and Profitability
We originally examined the flaws with accounting book value in January of 2016. We found that, on the surface P/B and ROE appear closely linked, but once you removed outliers, the r-squared fell to just 27%. When we run the regression today, again removing outliers[1], ROE explains just 21% of the difference in P/B between S&P 500 companies.
Figure 1: ROE vs. P/B for the S&P 500
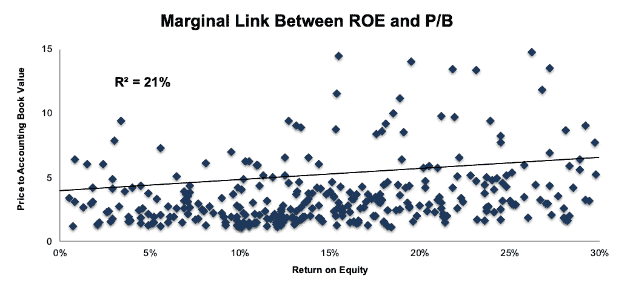
Sources: New Constructs, LLC and company filings
Of course, as we established in a previous Danger Zone article, ROE is misleading due to its reliance on flawed accounting earnings. Instead, let’s look at P/B compared to the truest measure of profitability, return on invested capital (ROIC).
Figure 2: ROIC vs. P/B for the S&P 500
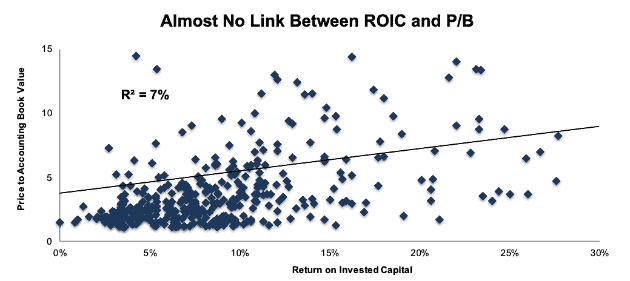
Sources: New Constructs, LLC and company filings
As Figure 2 shows, the r-squared value for ROIC and P/B is just 7%. The two metrics have almost no connection. Since we know that ROIC is the primary driver of value, this suggests that P/B is not a good valuation metric.
Flawed Metrics Lead to Underperformance of Value Strategies
Given the flaws of P/B, it should come as no surprise that so-called “value indexes” have struggled over the long term. Over the past 15 years, the iShares Russell 1000 Value ETF (IWD) is up just 115% while its growth counterpart (IWF) is up 207%. This long-term underperformance has led to many think pieces on the “Death of Value Investing”.
The reality is that value investing isn’t dead, it just needs updated metrics.
Book Value Can Be Misleading
Accounting book value suffers from these major flaws when it comes to valuing stocks:
- Accounting book value can be written down at management’s discretion at any time.
- Businesses can hide both assets and liabilities off the balance sheet so that they are not reflected in accounting book value.
- Accounting rules are designed to give the best estimate of liquidation value for debt investors, not to measure the capital used to generate returns, which is what matters to equity investors.
Since shareholder’s equity and accounting book value are the same thing, both ROE and P/B rely on this same accounting construct, which makes them both equally unreliable for equity investors.
The Threat Of Write-Downs
Mergers and acquisitions represent some of the most common sources of artificial book value. When one company buys another company at a premium to its market value, the excess purchase price is recorded as goodwill. Goodwill is recorded as part of accounting book value, but often ends up getting written down if the acquisition underperforms expectations.
Write-downs (also known as impairments) are very common. 53% of all acquisitions end up destroying value, and we’ve found tens of thousands of write-downs totaling over a trillion dollars in value in the filings we’ve parsed, which date back to 1998. In particular, write-downs tend to spike when the market’s valuation diverges sharply from economic book value (EBV), the zero-growth value of current cash flows.
Figure 3: Impairments Dating Back to 2000
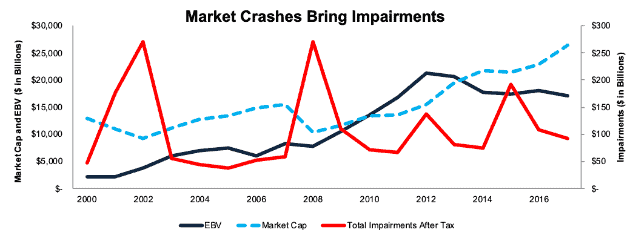
Sources: New Constructs, LLC and company filings
Investors who thought they owned cheap stocks based on P/B come in for a rude awakening when the market crashes. In a bear market, cash flows matter most, and if a company doesn’t produce the cash flows to support the book value of its assets, those assets will be written down.
Sears Holdings (SHLDQ) is a good example of this risk. When we first wrote about Sears in 2013, the stock had a relatively low P/B of 1.8. However, $3.3 billion (35%) of its accounting book value came from goodwill and other intangible assets such as brand names. In the years since, the majority of those intangible assets have been written down. Investors that thought they had a margin of safety due to the low P/B ended up losing 89% of their investment.
Figure 3 also helps to explain why a value strategy has underperformed since 2003 after beating the market for years. In 2002, the Financial Accounting Standards Board (FASB) moved from a system of goodwill amortization to goodwill impairment. Before 2002, companies that made acquisitions amortized the goodwill on the balance sheet on a regular schedule, regardless of the performance of the acquisition. This meant companies were regularly decreasing their goodwill on the balance sheet and preventing it from inflating book value.
After 2002, companies no longer had to amortize goodwill, only test it for impairment each year. This change led to the pattern in Figure 3, where companies have overstated goodwill inflating the balance sheet for years until a market crash finally forced them to wipe it out entirely.
This accounting rule change isn’t the only factor leading to the underperformance of value over the past 15 years, but it is a significant and underappreciated contributor.
Hidden Assets and Liabilities Further Cloud the Picture
We make several adjustments to convert total assets to invested capital because companies can hide assets and liabilities off the balance sheet in the form of reserves, operating leases, deferred compensation, etc.
These off-balance sheet arrangements mean that the shareholder’s equity line ignores a significant amount of the resources that a company uses in its operations.
In addition, the accounting book value of intangible assets varies significantly depending on whether a company acquires them or develops them organically. Colgate-Palmolive (CL), which we featured as a hidden value gem earlier this year, has a negative accounting book value because its most valuable assets are brands it has developed over its hundred plus years of existence. Meanwhile, its competitor Procter & Gamble (PG) looks cheaper based on price to book due to the goodwill on the balance sheet from its numerous acquisitions. The two companies have similar businesses, but one looks significantly cheaper than the other simply because of flawed accounting constructs.
Liquidation Value Has Limited Value for Equity Investors
Accounting book value is meant to measure the potential assets available to investors in the event of liquidation, and that value is simply not a very useful measurement for most equity investors. If you buy stock in a company that gets liquidated, you’re likely chalking it up as a failed investment.
Even the idea that a low price to book limits your potential downside is flawed. Write-downs or hidden liabilities can send the stock price below book value, as can a company earning a negative return on invested capital (see Sears above).
Accounting rules were originally designed to be used by debt investors. Equity investors should not expect the financial statements generated by these rules to contain the numbers that accurately reflect their concerns.
A Better Measure of Value
Instead of using P/B, we prefer to use enterprise value divided by invested capital (“EV/IC”). Invested capital captures all the operating assets of a business, both on and off the balance sheet, and it is not as easily distorted by a company’s capital structure. As Figure 4 shows, the r-squared value for ROIC vs. EV/IC is a much higher 53%, and we don’t have to get rid of any pesky outliers in this regression.
Figure 4: ROIC Vs. EV/IC for the S&P 500
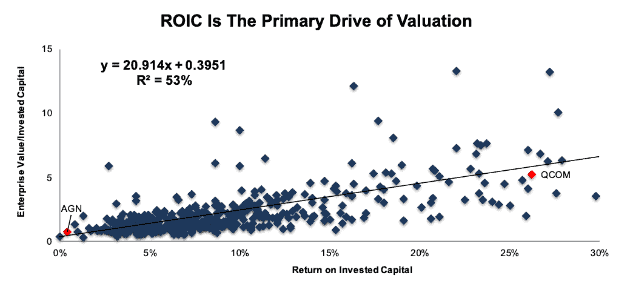
Sources: New Constructs, LLC and company filings
Importantly, investors still need to look at ROIC when they consider a company’s valuation. Allergan (AGN: $154), highlighted in Figure 4, has a price to book of 0.74 and an EV/IC of 0.76. These low numbers might make investors think that the stock is cheap.
However, a quick look at the balance sheet shows that $98 billion of AGN’s assets (92% of total assets) come from goodwill and other intangibles. The company’s low ROIC of just 0.4% suggests that these intangible assets are significantly overvalued, and investors should be on the lookout for future impairments. If AGN were to trade at its fair value based on the trendline in Figure 4, the stock would be worth just $67/share today, a 57% downside from the current price.
On the other side of the coin, Qualcomm (QCOM: $57/share) might look expensive based on its P/B of 75. However, the stock has much more reasonable EV/IC of 5.2, and when we consider its ROIC of 26% the stock looks downright cheap. If QCOM were to trade at the valuation implied by the trendline in Figure 4, it would be worth $65/share today, a 14% upside from the current price.
QCOM’s accounting book value may be low, but the company has valuable assets such as technological expertise and customer relationships that are not captured on the balance sheet. These assets help the company earn a superior ROIC and justify a much higher multiple to invested capital.
No one number can tell the whole story of a company, especially when that number is as flawed as price to book. Investors deserve unconflicted and comprehensive fundamental research and should seek more sophisticated metrics and analysis that provide a truer measure of value.
Value investing is not dead as long as you have the research that can handle the growing complexity and volume of today’s accounting disclosures.
Read our previous article "The Problem With Using Accounting Book Value."
This article originally published on December 10, 2018.
Disclosure: David Trainer, Kyle Guske II, and Sam McBride receive no compensation to write about any specific stock, sector, style, or theme.
Follow us on Twitter, Facebook, LinkedIn, and StockTwits for real-time alerts on all our research.
[1] Any company with a P/B below -100 or above 100.
1 Response to "How Price to Book Misleads Investors"
EV/IC does have a benefit to avoid the distortion from captial structure.
But both EV and IC have to use the book values as well, therefore, it will not address the problem from P/B ratio in this regard. Unless we do the modification, for example, excluding the goodwill/intangible assets or smoothing them out.