Question: Why are there so many ETFs?
Answer: ETF issuance is profitable, so Wall Street keeps cranking out more products to sell.
The large number of ETFs has little to do with serving your best interests as an investor. More reliable & proprietary fundamental data, proven in The Journal of Financial Economics, drives our research and analysis of ETF holdings and provides investors with a new source of alpha. We leverage this data to identify three red flags you can use to avoid the worst ETFs:
1. Inadequate Liquidity
This issue is the easiest to avoid, and our advice is simple. Avoid all ETFs with less than $100 million in assets. Low levels of liquidity can lead to a discrepancy between the price of the ETF and the underlying value of the securities it holds. Small ETFs also generally have lower trading volume, which translates to higher trading costs via larger bid-ask spreads.
2. High Fees
ETFs should be cheap, but not all of them are. The first step is to benchmark what cheap means.
To ensure you are paying average or below average fees, invest only in ETFs with total annual costs below 0.50% - the average total annual costs of the 291 U.S. equity Sector ETFs we cover. The weighted average is lower at 0.26%, which highlights how investors tend to put their money in ETFs with low fees.
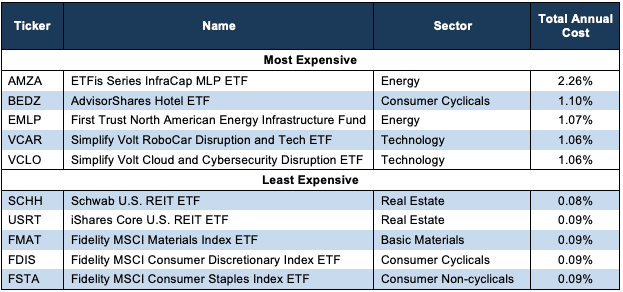
Figure 1 shows ETFis Series InfraCap MLP ETF (AMZA) is the most expensive sector ETF and Schwab U.S. REIT ETF (SCHH) is the least expensive. Fidelity (FMAT, FDIS, FSTA) provides three of the most expensive ETFs while Simplify (VACR, VCLO) ETFs are among the cheapest.
Figure 1: 5 Most and Least Expensive Sector ETFs
Sources: New Constructs, LLC and company filings
Investors need not pay high fees for quality holdings.[1] Fidelity MSCI Consumer Staples Index ETF (FSTA) is one of the best ranked sector ETFs in Figure 1. FSTA’s Attractive Portfolio Management rating and 0.09% total annual cost earn it a Very Attractive rating.[2] SPDR S&P Capital Markets ETF (KCE) is the best ranked sector ETF overall. KCE’s Very Attractive Portfolio Management rating and 0.39% total annual cost also earn it a Very Attractive rating.
On the other hand, Schwab U.S. REIT ETF (SCHH) holds poor stocks and earns our Very Unattractive rating despite having low total annual costs of 0.08%. No matter how cheap an ETF looks, if it holds bad stocks performance will be bad. The quality of an ETF’s holdings matters more than its management fee.
3. Poor Holdings
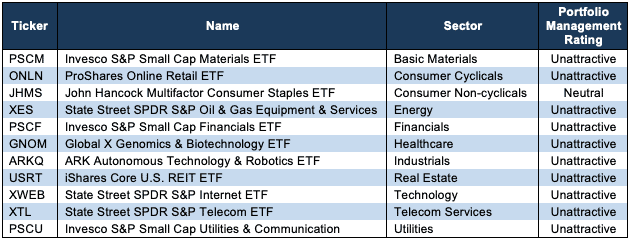
Avoiding poor holdings is by far the hardest part of avoiding bad ETFs, but it is also the most important because an ETF’s performance is determined more by its holdings than its costs. Figure 2 shows the ETFs within each sector with the worst portfolio management ratings, a function of the fund’s holdings.
Figure 2: Sector ETFs with the Worst Holdings
Sources: New Constructs, LLC and company filings
Invesco (PSCM, PSCF, PSCU) and State Street (XES, XWEB, XTL) appear more often than any other providers in Figure 2, which means that they offer numerous ETFs with the worst holdings.
State Street SPDR S&P Internet ETF (XWEB) is the worst rated ETF in Figure 2. Global X Genomics & Biotechnology ETF (GNOM), ARK Autonomous Technology & Robotics ETF (ARKQ), ProShares Online Retail ETF (ONLN), iShares Core U.S. REIT ETF (USRT), Invesco S&P Small Cap Utilities & Communication (PSCU), and State Street SPDR S&P Oil & Gas Equipment & Services ETF (XES) also earn a Very Unattractive predictive overall rating, which means not only do they hold poor stocks, they charge high total annual costs.
Our overall ratings on ETFs are on our stock ratings of their holdings and the total annual costs of investing in the ETF.
The Danger Within
Buying an ETF without analyzing its holdings is like buying a stock without analyzing its business model and finances. Put another way, research on ETF holdings is necessary due diligence because an ETF’s performance is only as good as its holdings. Don’t just take our word for it, see what Barron’s says on this matter.
PERFORMANCE OF ETF HOLDINGS - FEES = PERFORMANCE OF ETF
Analyzing each holding within funds is no small task. Our Robo-Analyst technology enables us to perform this diligence with scale and provide the research needed to fulfill the fiduciary duty of care. More of the biggest names in the financial industry (see At BlackRock, Machines Are Rising Over Managers to Pick Stocks) are now embracing technology to leverage machines in the investment research process. Technology may be the only solution to the dual mandate for research: cut costs and fulfill the fiduciary duty of care. Investors, clients, advisors and analysts deserve the latest technology to get the diligence required to make prudent investment decisions.
This article originally published on April 29, 2022.
Disclosure: Kyle Guske II owns USRT. David Trainer, Kyle Guske II, and Matt Shuler receive no compensation to write about any specific stock, sector, or theme.
Follow us on Twitter, Facebook, LinkedIn, and StockTwits for real-time alerts on all our research.
[1] Three independent studies from respected institutions prove the superiority of our data, models, and ratings. Learn more here.
[2] Harvard Business School features the powerful impact of our research automation technology in the case New Constructs: Disrupting Fundamental Analysis with Robo-Analysts.