
During bull markets, investors love to chase risky momentum stocks with questionable fundamentals in pursuit of big returns. When volatility increases and markets decline, on the other hand, investors get spooked and start putting more of their money in investments that are perceived as safer and “higher quality”.
With the significant drop in the market to start 2016, we can be sure that many investors are looking to shift their portfolios towards higher quality stocks. The challenge is how to define “high-quality” because it is not as straightforward as one might think.
ETF investors may view the PowerShares S&P 500 High Quality Portfolio (SPHQ) as an appealing option. After all, the words “high quality” are right there in the name. Over the past six months, SPHQ has seen net inflows of $144 million, nearly triple the cash coming in to the similarly sized S&P 500 Growth ETF (SPYG).
However, investors that truly want to invest in quality stocks need to dig a little deeper. While SPHQ does a better-than-average job of selecting stocks with strong fundamentals, its flawed methodology means investors are getting exposure to some companies with significant weakness in their underlying business.
Accounting Earnings Are Unreliable
SPHQ tracks the S&P 500 High Quality Rankings Index, which, according to its website, “includes companies rated A- or above based on per-share earnings and dividend payout records for the past 10 years.”
As we’ve written about many times before, reported earnings and dividends are not reliable indicators of the underlying quality of a business. High dividend paying stocks can end up being dividend traps, and flawed accounting rules mean that EPS growth has almost no correlation with value creation.
Identifying fundamentally sound companies requires more work than just looking at EPS and dividends. SPHQ’s overly simplistic methods allow for some distinctly low quality businesses to find their way into this ETF.
Low Quality Businesses In A High Quality ETF
The ultimate marker of a high quality business is earning a return on invested capital (ROIC) above its weighted average cost of capital (WACC). These excess returns drive economic earnings, a far truer measure of profits for equity investors.
Figure 1 shows the nine companies in SPHQ that fail this very basic test, having earned negative economic earnings in each of the past five years.
Figure 1: SPHQ Stocks With Low-Quality Businesses
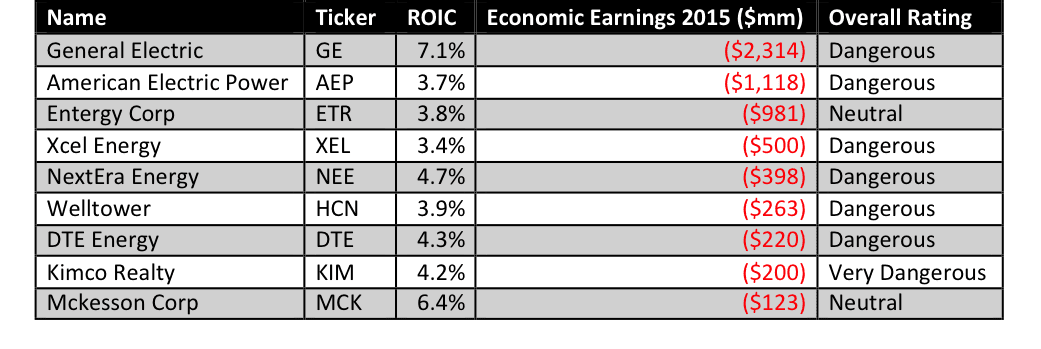
Sources: New Constructs, LLC and company filings.
General Electric (GE) stands out at the top of Figure 1. The industrial conglomerate has not turned an economic profit since 2006, and its balance sheet is not as strong as it first appears either. $3.5 billion in off-balance sheet debt due to operating leases add to the company’s liabilities.
GE has a reputation as a stable business, and the massive sale of GE Capital provides cash to continue serving its 3.2% dividend for many years because the rest of the business is not making money. The firm’s dismal economic earnings prove the underlying business is not nearly as strong as it once was, and the stock’s 8% drop so far this year shows it’s far from safe in a bad market.
Utilities make up a good portion of Figure 1, unsurprising for a sector that consistently is near the bottom of our sector ratings. Xcel Energy (XEL) is one of the worst, as it has failed to earn an ROIC above 4% going all the way back to 2002.
Even worse, the company has only recorded positive free cash flow once in the past decade. It funds its dividend through taking on more long-term debt, which has ballooned from $7 billion to $17 billion in the past decade. Over $2 billion of that debt is hidden off the balance sheet.
Accounting earnings would suggest that XEL is improving, with EPS improving by 6% in the last fiscal year. However, that improvement is almost entirely due to changes in non-operating pension costs, due in part to the company increasing its expected return on plan assets. When we strip out these non-operating items, we see that the company’s true after-tax operating profit (NOPAT) declined by 3%.
Investors in SPHQ might be surprised to learn that they hold a stake in a company with such a poor track record of destroying shareholder value.
Economic Earnings Matter Most In A Tough Market
When markets get shaky, it’s not the companies with EPS growth that weather the storm, it’s those that deliver solid economic earnings. Just look at the crash of 2008. The only stocks that delivered solid returns to investors while the market crashed were those that earned a high ROIC. That is the pattern investors should follow for long-term success in the market.
SPHQ is better than a lot of other ETFs out there, and over 75% of its holdings earn out Neutral-or-better rating. Still, its “high-quality” moniker, combined with the lack of diligence involved in selecting its holdings, may mislead some investors.
Surviving a market crash is hard. You can’t just trust an ETF’s label and hope your investments will be safe. It takes real diligence and discipline to reveal the true quality of a company’s earnings and measure the strength of its underlying business.
We will be the first to tell you that good fundamental research is rare, time-consuming, and expensive. As a result, by the time many investors realize they need fundamental research, it’s too late. Their portfolios have been crushed.
We think the recent decline in liquidity is going to lead the market to recognize the true, long-term fundamentals of lots of stocks, a trend that began in 2015 and led to significant outperformance by our Most Dangerous Stocks newsletter as well as many of our Danger Zone picks in 2015. Less liquidity means more natural price discovery, something many experts have warned has been missing for too long. Those same experts have noted that when natural price discovery came back, it could do so with a vengeance. Markets could be volatile for a while. Be prepared.
Disclosure: David Trainer and Sam McBride receive no compensation to write about any specific stock, sector, style, or theme.
Click here to download a PDF of this report.
Photo Credit: Jason Taellious (Flickr)