While everyone else was cheering Nvidia’s (NVDA) stock back to new heights this week, I called the top for the stock first thing Monday (August 26th) morning on Chuck Jaffe’s MoneyLife show. You can listen to the whole interview here – my part starts at the 23:12 mark. If you want just my part, you can get it here.
In this letter, I am going to show you my secret weapon for calling the top in NVDA, the most important stock in the market. My secret weapon works for other stocks, too. I’m going to show you how to use it to call the top for another very popular stock. Watch the video tutorial for this report below.
See more Reverse DCF case studies in our private online community (use this form to sign up for free).
I’m not guaranteeing that either stock won’t go back up like a crazy meme stock. These days anything is possible. But, I went out on a limb to say I think NVDA is headed down, way down for two reasons:
- Liquidity is drying up – as detailed in this letter (see the section titled “Why Is the Yen Carry Trade A Big Deal?”).
- My secret weapon raised red flags.
I needed to see liquidity dry up before I could apply my secret weapon. As one of my favorite hedge fund clients told me many years ago, the “only thing that causes a bubble to pop is a liquidity pinch.” And, that’s exactly what we saw on August 5th.
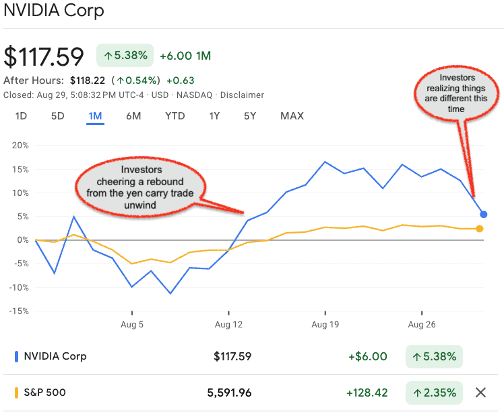
Figure 1: NVDA Price Movements
Sources: Google Finance
When I saw how much that liquidity pinch affected NVDA, I, along with many other folks, noted that much of the money pouring into NVDA was leveraged capital from the yen carry trade. Lots of investors were shorting the yen and putting that money into NVDA. In other words, investors were “speculating” not “investing” in NVDA, they were looking to make a quick buck with cheap capital.
Next, I needed to be sure that the liquidity pinch would continue and that neither the U.S. Federal Reserve nor the Bank of Japan were going to pull strings to re-ignite the yen carry trade. When they did not, I knew it was time to pull out my secret weapon for finding the most overvalued stocks in the market.
I first learned how to use this weapon back in 1996 when I started as an equity research analyst for Credit Suisse|First Boston, and I have been perfecting my techniques ever since. My mentors, Michael Mauboussin and Paul Johnson, were the first Wall Street analysts to put this weapon to work on stocks. Michael and Paul published a seminal report on the weapon in January of 1997 titled: Competitive Advantage Period “CAP” – The Neglected Value Driver. I liked the report so much that I printed out extra copies and handed it out to every analyst at the firm. Michael went on to co-author an entire book on the weapon with Alfred Rappaport called Expectations Investing, which is in its second edition.
My favorite quote from the Expectations Investing website is:
“Investors who use Expectations Investing will have a fundamentally better way to evaluate all stocks, setting them on the path to success.”
I agree 100% with that quote. I believe my clients and I get a huge edge from using this weapon. While the concept of expectations investing is rather easy to understand, it is very difficult to apply in the real world, especially at scale. When I started New Constructs, one of the first things we built into our technology was the ability to mass produce this weapon.
So, you’re probably wondering what this “weapon” is. I’m going to tell you what it is, and then I am going to show you how I use it.
The weapon is a reverse dynamic discounted cash flow model (DCF). Our clients will tell you that it is not just any discounted cash flow model, it is the best in the world for two reasons:
- It’s driven by our proven-superior fundamental data. Models are only as good as the data that drives them, and we have the best data in the world.
- It is super easy to use.
What the heck is a “DCF” model?
The Discounted Cash Flow (DCF) model is a popular valuation tool that analysts use to determine the value of stocks.
From Google: “A Discounted Cash Flow (DCF) model is a financial model that estimates a company’s value by forecasting its future cash flows and discounting them to the present value. The model’s basis is that a company’s value is determined by its ability to generate cash flows for its investors.
DCF models are based on the belief that the value of an asset is equal to the present value of the cash flows it generates now and in the future. “Present” value means that the future cash flows are discounted to today’s value. This discount is necessary to account for the fact that cash in hand today is worth more than cash in hand a year from now, i.e. “time value of money”. The value of future cash flows is lowered by (1) inflation and (2) risk that those cash flows do not materialize.
Traditional DCF models rely on the analysts to forecast the future cash flows of a company, which determines the value of the company. In other words, they require analysts to predict the future of a company.
Most DCFs Are NOT Easy To Use
When I first started using the reverse dynamic DCF back in 1996, everything was in an excel model, a very big and complicated model. When I rebuilt the model for the Value Dynamics Framework business that I ran for Credit Suisse|First Boston, I worked hard to simplify and make it easier for my clients (research analysts and portfolio managers) to understand. But, there’s only so much you can do to make a complicated excel model easier to use.
And, even worse, I had to create and build a new DCF model for every new company we wanted to cover. That meant reading lots of 10K filings, entering lots of data and building out lots of forecasts. Talk about a lot of very complex and complicated work. For those that really want to learn how models work, it makes sense to build at least a couple of these models by hand. After that, you have to be a special kind of nerd to want to do more. You’re probably not surprised to learn that there are not many people on this planet that want to know how these models work enough to invest the time to learn how to build one. Even fewer, who want to build more than the minimum number needed to learn how they work. Trust me, I saw, first hand, the apathy for building good models on Wall Street during the tech bubble – as detailed in this e-letter.
I did not share that apathy, and I probably built over a thousand dynamic DCF models. My team built another couple of thousand of these excel models. Yes, I admit that I am a nerd. Just don’t tell my buddies at Renzo Gracie Nashville that – haha.
The Robo-Analyst: Necessity is the Mother of Invention
When I wrote the business plan for New Constructs, I knew we needed to automate the creation of these models because they are honestly too much very complicated work for just about any investor to undertake.
I believed we could build technology that would automate the creation of the models. And, if we were successful, we could give everyone access to this superior analytical weapon for analyzing stocks. Giving everyone access to this weapon meant everyone would be empowered with “a fundamentally better way to evaluate all stocks” – that’s what New Constructs is about. For those of you that already know me, you probably remember that the mission for New Constructs is “to improve the integrity of the capital markets.”
Those of you who already know me also know we succeeded in building that technology, which is known in the industry as the Robo-Analyst. It’s been featured in multiple top-tier publications including the Harvard Business School Case 118-068: “New Constructs: Disrupting Fundamental Analysis with Robo-Analysts”. If you email me and promise to take the case for personal use only, I’ll send you a copy.
Now, let me show you how I used this weapon to call the top in NVDA.
What the heck is a “reverse” DCF model?
First, a quick note on the key concept behind how the “reverse” dynamic DCF model works. The first question I like to ask our new analyst trainees is: would you rather be a fortune teller or a critic of a fortune teller? I think it’s much easier to be a critic of someone trying to predict the future than to predict it myself. And, our reverse DCF models work the same way. These models do not attempt to predict the future. Instead, they reverse engineer the future cash flows required for the model to produce a value equal to the stock price. In other words, we start with the stock price and figure out what the future cash flows have to be to justify that stock price. Ok, now let’s get into the details.
How to Load the Weapon
*WARNING*
Buckle up because I’m about to take you deep into nerdland when it comes to valuing stocks.
I logged into our Robo-Analyst website and opened the model for Nvidia. The first thing I saw: our Default scenario in our DCF model showed that it would take Nvidia over 100 years to grow into the profits needed to justify its stock price. The Default[1] scenario is based on:
- Consensus estimates for revenue growth
- Future NOPAT margins are roughly the same as past margins
- Capital efficiency improves pretty aggressively.
Given that few investors want to think in terms of a hundred-year forecast horizon, I created two new scenarios for Nvidia’s future cash flows: Optimistic and Pessimistic. Here’s a summary of what I changed versus the Default scenarios:
- Optimistic scenario: higher revenue growth and higher profit margins
- Pessimistic scenario: lower revenue growth and lower profit margins
How To Aim the Weapon
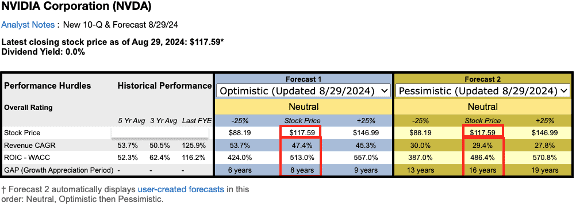
Let me show you exactly what all that means. Figure 2 is a picture from the Decision page in our company models. The purpose of the Decision page is to summarize the reverse dynamic DCF into a table and a few charts so clients can get a quick and easy read of the results of the model. Now, there’s still a lot of information to digest here – haha, I told you to buckle up – so I am breaking the Decision page into three parts: 1. the summary table (Figure 2), 2. the implied stock price charts (Figure 3) and 3. the implied future revenue and ROIC (Figures 4 & 6).
Figure 2, from left to right, what the model is showing:
- The grey section presents the key variables over recent history.
- Revenue CAGR (“CAGR” stands for Compound Annual Growth Rate)
- ROIC – WACC = Return on Invested Capital minus Weighted Average Cost of Capital
- GAP (Growth Appreciation Period) = our term for CAP (Competitive Advantage Period). They are exactly the same thing.
- Forecast 1 section shows the future performances required to justify the current price based on the Optimistic scenario.
- Forecast 2 section shows the future performances required to justify the current price based on the Pessimistic scenario.
A key benefit to this table is that it allows for easy comparison between past performance of key variables to implied future performance.
Figure 2: Summary Tables for the Reverse Dynamic DCF for NVDA
Sources: New Constructs Company Valuation Models
To keep things simple, I am going to focus on explaining the tables based on the current stock price ($117.59), or the sections in red boxes.
- In the Optimistic scenario, to justify $117.59, Nvdia must grow revenue at 47% CAGR while achieving an average ROIC-WACC spread of 513% for the next 8 years.
- In the Pessimistic scenario, to justify $117.59, Nvdia must grow revenue at 29% CAGR while achieving an average ROIC-WACC spread of 486% for the next 16 years.
What is a “dynamic” DCF model?
One last explanatory point here. The difference between a dynamic DCF and a traditional DCF model is in the forecast horizon. Traditional DCF models typically have one forecast horizon, e.g 5 years. Dynamic DCF models use multiple forecast horizons so that the user can solve for the GAP or CAP. A shortcoming in traditional DCF models is that they require an assumption on how much the cash flows after the forecast horizon (e.g. 5 years) grow. This future cash flow growth assumption can have a very large impact on the value of the stock. Dynamic DCF models do not require that assumption because their forecast horizons can be extended for as long as necessary to capture all the future cash flow growth.
How To Fire the Weapon: Part 1
As an investor, the question you must answer is whether or not you believe that Nvidia can achieve the performance implied by the stock price. That question is the entire point of Expectations Investing. The beauty of Expectations Investing is that it relieves the investor of having to predict the future. Instead, the investor gets to be a critic of the future implied by the stock price. Now, a key point here is that the only way to be a well-informed critic is to quantify the expectations embedded in the stock price. And, that is exactly what our reverse dynamic DCF models do for clients.
Another way to pose the questions is: the market, via the stock price, is predicting that Nvidia can grow revenues and reach the ROIC-WACC spread for the respective GAPs. Do you agree?
- If your answer is yes, then the stock is fairly valued.
- If you think Nvidia will do even better, then the stock is cheap.
- If you think Nvidia will do worse, then the stock is expensive.
Next, I am going to show you how our models can make answering this question easy.
First, our dynamic DCF quantifies the market’s expectations based on common-sense operational metrics (e.g. revenue growth and ROIC) that you can compare to the historical performance of the business and to your own expectations about the future performance of the business. Valuation doesn’t have to be done through a multiple that’s difficult to understand.
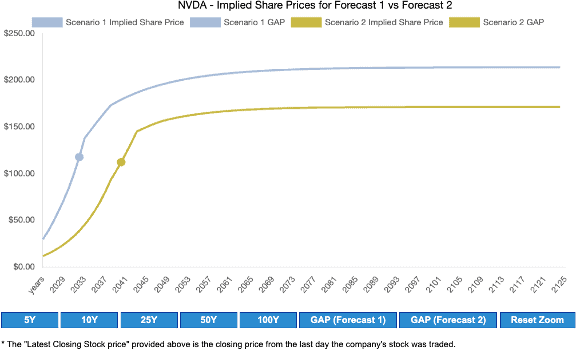
Figure 3 shows the implied share prices over multiple Growth Appreciation Periods so you can see how the different scenarios affect the valuation of the stock. Not surprisingly, the slope of the Optimistic line is steeper than the Pessimistic line because of the faster revenue CAGR assumptions in the Optimistic scenario. I want you to see this chart because it shows how we find the market-implied GAPs. It shows how we run scenarios over as long a time frame as needed for the DCF model to get to the current stock price. The year in which the DCF model produces a stock value equal to the current stock price is the market-implied GAP. The market-implied GAP is important for many reasons, but, in particular, it is important for creating charts like what we show in Figure 4.
Figure 3: Summary Tables for the Reverse Dynamic DCF Scenarios for NVDA
Sources: New Constructs Company Valuation Models
How To Fire the Weapon: Part 2
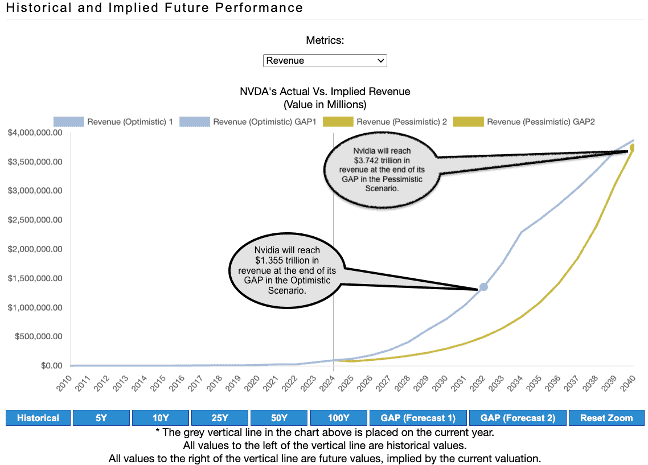
Now, where this gets fun is using charts to compare historical revenues, ROIC and cash flow to the future levels implied by each scenario. Check out Figure 4, which shows how Nvidia’s past revenue compares to the future revenues implied by each scenario. This chart shows us that Nvidia’s revenue will reach $1.3 trillion at the end of its GAP for the Optimistic scenario[2]. And, its revenue will reach $3.7 trillion at the end of its GAP for the Pessimistic Scenario. The chart also shows the magnitude of the improvement in revenue compared to where the company has been in the past. Just look at how low and flat the revenue line is going back to 2010. The future implied revenues make the past revenue look tiny.
Figure 4: Comparing Historical Revenue to Implied Future Revenue
Sources: New Constructs Company Valuation Models
Still, when I saw $1.4 and $3.7 trillion, I was stunned. Seems like a big number. How big?
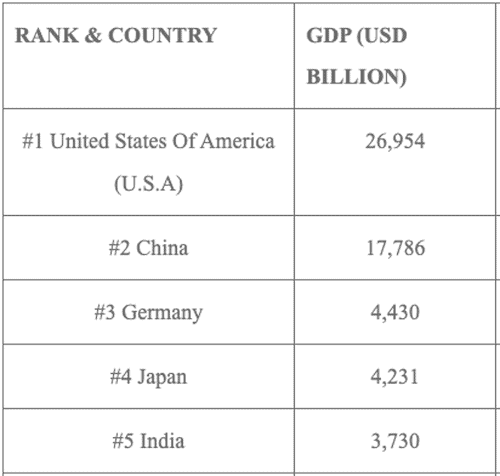
We need some context on how big $1.4 and $3.7 trillion in revenue is. Let’s start with the fact that Apple’s revenue at the end of its 3Q24 was $385.6 billion, less than 1/3rd of $1.4 trillion and about 1/10th of $3.7 trillion. Hmm, that makes those revenue expectations seem pretty big. Here’s another perspective: $3.7 trillion in revenue would make Nvidia as big as India, the 5th largest GDP in the world in 2023. See Figure 5.
Revenues of $1.355 trillion would make Nvidia bigger than Turkey, the #17-ranked country in the world based on 2023 GDP. After seeing that, I decided I thought the future performance expectations for Nvidia might be too high, way too high.
Figure 5: GDP of Largest Countries in 2023
Sources: Google Search
How To Fire the Weapon: Part 3
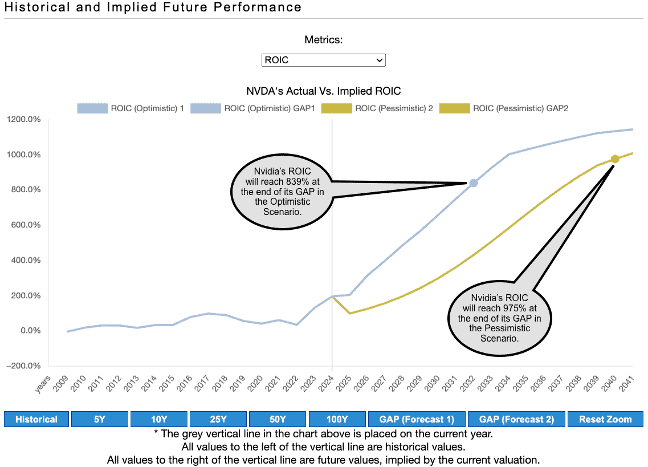
Next, I wanted to see what the implied future ROICs looked like because companies can grow revenues and take market share if they slash prices and margins, which means ROICs usually come way down. In other words, revenue growth at any level, but especially large revenue growth like that in the Optimistic and Pessimistic scenarios, is next to impossible to achieve while also increasing ROIC. So, I ran the same comparison for ROIC as I did for revenue, and you can see the results in Figure 6.
“Wow” was my reaction. Like Figure 4, Figure 6 shows the magnitude of the improvement in ROIC compared to where the company has been in the past. Nevertheless, more contact on how those implied ROIC compare to the best ROICs in recent history would be helpful.
Figure 6: Comparing Historical ROIC to Implied Future ROIC
Sources: New Constructs Company Valuation Models
We need more context here to really understand how reasonable or unreasonable it is to believe that Nvidia will achieve an 839% or 975% ROIC while also growing revenue at the rates shown above. Fortunately, New Constructs is the perfect system to research ROIC stats.
First, Nvidia’s current ROIC is 195%, which is 6x higher than 2023 and much higher than the 130% it achieved in fiscal year 2024.
Next, I looked at the number of times over the last 5 years that a company in the S&P 500 achieved an ROIC greater than 100%. Here are the results.
- 100%: 11 times
- 200%: 7 times
- 300%: 3 times
- 500%: 2 times
- 600%: 1 time
- 700%: none
Over the last 5 years, only one company in the S&P 500 averaged more than 100% ROIC.
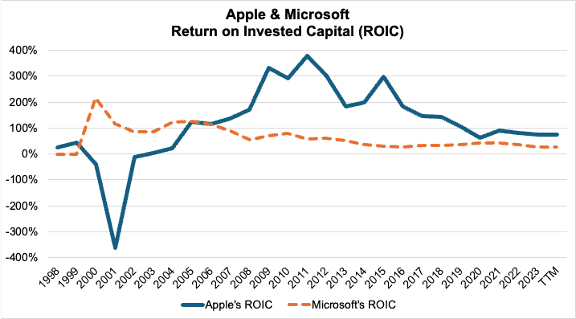
Lastly, I reviewed two of the highest ROIC businesses of all time in technology: Apple and Microsoft. Figure 7 plots their ROICs from 1998 to present. Apple’s ROIC peaked at nearly 400% and is now well under 100%. Microsoft peaked at 200% and is now well under 30%.
The takeaway for me is that it’s more likely that hell will freeze over than Nvidia will get to an ROIC over 800%.
Figure 7: ROIC Trends for Apple and Microsoft from 1998- Present
Sources: New Constructs Company Valuation Models
I Love the Smell of Napalm in the Morning
Needless to say, I think it’s even less likely that Nvidia will grow revenues at 47% or 29% while also achieving such huge increases in ROIC as detailed in the scenarios above.
And given the liquidity pinch, I decided to call the top for NVDA.
How You Get an Edge
Now, my secret weapon is no longer my secret. It’s yours, too.
I hope this report shows you why I think the New Constructs reverse dynamic DCF model, along with our research platform, is a weapon that can give you “a fundamentally better way to evaluate all stocks, setting <you> on the path to success.”
Having the ability to quantify market expectations with precision and based on the best fundamental data in the world is a huge competitive advantage for investors. Add the ability to compare the performance track records of thousands of companies over the last 25+ years, and I think it’s fair to say we have a pretty powerful weapon that gives us and our clients a large proprietary edge.
With the GAP rating as a core component of our Stock Ratings, every one of our clients from the Stock Tracker 50 to the Institutional user gets to use this weapon.
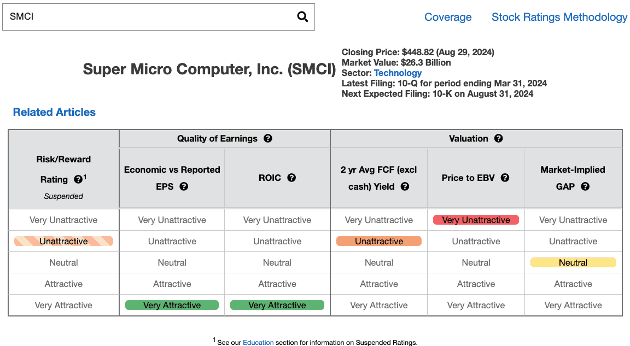
As for the other stock I mentioned at the beginning of this letter. It’s Super Micro Computer, Inc. (SMCI). I mentioned it on air on Tuesday as like Nvidia – a very expensive stock with lots of downside risk. I also pointed out that we suspended the rating for a major red flag we found in the footnotes. Needless to say, we were not surprised at all to see the stock take a huge hit this week.
As you can see from Figure 8, the company’s Valuation metrics are flashing red. They were even more red before the stock tanked. When we ran the reverse DCF model on SMCI last week, we saw similar signs of over valuation as we saw with Nvidia. Same story, different stock.
Figure 8: Rating for Super Micro Computer, Inc. (SMCI)
Sources: New Constructs Ratings page
If you’d like to see some live action use of our reverse DCF model, join our private online community (use this form to sign up for free) and check out Reverse DCF case studies.
Want more details on New Constructs?
As always, we are 100% transparent in all of our research, reports, ratings, and models. We regularly review our work and research on Long Ideas and Danger Zone Ideas with clients. We want you to know how much work we do! Here’s some ways to keep in touch with us:
- Free live Podcast every month. The next one is on Friday, September 13th, register here. The last one was August 9th. Get free replays in our online community.
- Join our online community (use this form to sign up for free). Ask questions and make friends! Lots of humble investors talking to each other is a good thing.
- Monthly Let’s Talk Long Ideas webinars where we do deep dives into our research, analytics, reverse DCF models and ideas for our Professional and Institutional clients. Our next one is on August 14th at 5:00pmET. Replays are here for our Professional and Institutional clients.
If this message resonated with you and you want to start your investing future with us – schedule a meeting with us here.
Diligence matters,
David
This article was originally published on September 3, 2024.
Disclosure: David Trainer, Kyle Guske II, and Hakan Salt, receive no compensation to write about any specific stock, sector, style, or theme.
Questions on this report or others? Join our online community and connect with us directly.
[1] The same is true for the Default scenario in most of our models.
[2] We use a no-growth terminal value in our DCF models. The formula is NOPAT(t+1)/WACC. Note that we believe a no-growth terminal value is necessary for a reverse dynamic DCF model to have integrity.

