
All members can now access our Credit Ratings and research for all companies under coverage.
Our credit ratings are different than ratings from traditional credit research firms because we use our Adjusted Fundamentals instead of unscrubbed data, which is proven to be incomplete and less reliable by The Journal of Financial Economics.
Our Overall Credit Ratings are based on five fixed income ratios. We use a 1 to 5 rating scale for each ratio, with 1 as the best (Very Attractive) and 5 as the worst (Very Unattractive). Figure 1 is a generic sample of our Credit Rating table. Details on our Credit Rating methodology are here.
Figure 1: Credit Ratings Table
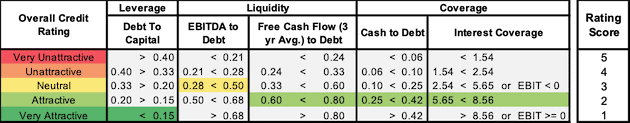
Sources: New Constructs, LLC
Members can get our Credit Ratings on the Portfolios, Ratings, and Screeners pages.
Portfolios page: expand the rating details in the first column of any stock in your Portfolio, and then click the “Switch to Credit Rating” button. See image below.
Figure 2: Credit Rating for All Stocks in Your Portfolio
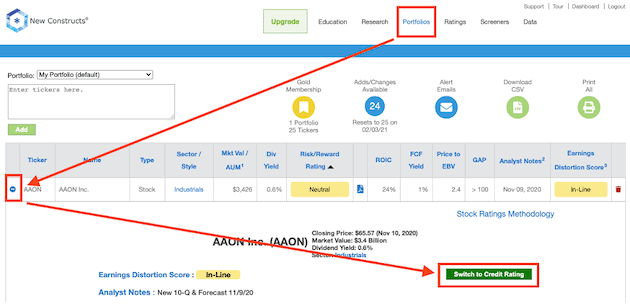
Sources: New Constructs, LLC
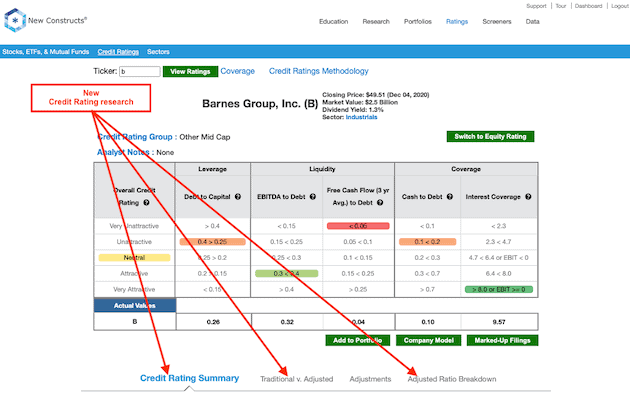
Ratings Page: enter any stock ticker and click the “Switch to Credit Rating” button to view the Credit Rating. See Figure 3.
Figure 3: Credit Ratings on the Ratings Page
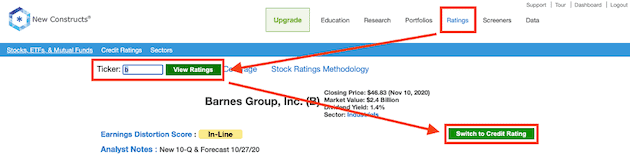
Sources: New Constructs, LLC
You can also click “Credit Ratings” from the blue menu bar, enter a ticker and get our Credit Rating. See Figure 4.
Figure 4: Credit Ratings on the Ratings Page Menu Bar
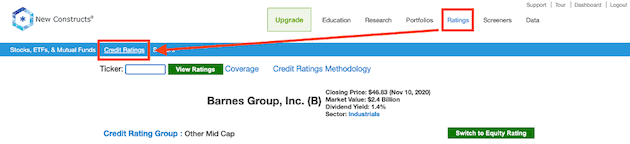
Sources: New Constructs, LLC
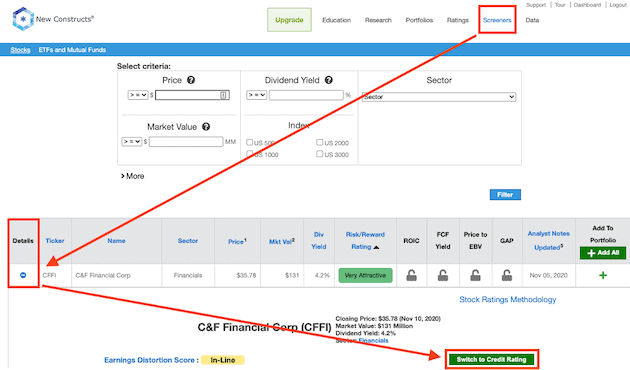
Stock Screeners page: click the button in the Details column and then the “Switch to Credit Rating” button to view the Credit Rating. See Figure 5.
Figure 5: Credit Ratings on the Screeners Page
Sources: New Constructs, LLC
More Credit Rating Research
We provide additional Credit Rating research:
- A Credit Rating Summary,
- Comparison of Traditional v. Adjusted Ratios,
- Adjusted Ratio Breakdown to show how we calculate each ratio.
This research is available to all members on their Portfolios page, to Platinum and higher members on the Ratings page, and to Unlimited and higher members on the Screeners pages.
Figure 6: More Credit Rating Research Below Credit Rating Table
Sources: New Constructs, LLC
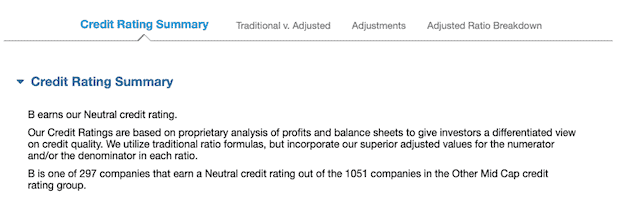
Credit Rating Summary Tab
Get a brief summary of our Overall Credit Rating and details on where each company ranks versus peers in its credit rating group.
Figure 7: Credit Ratings Summary Details
Sources: New Constructs, LLC
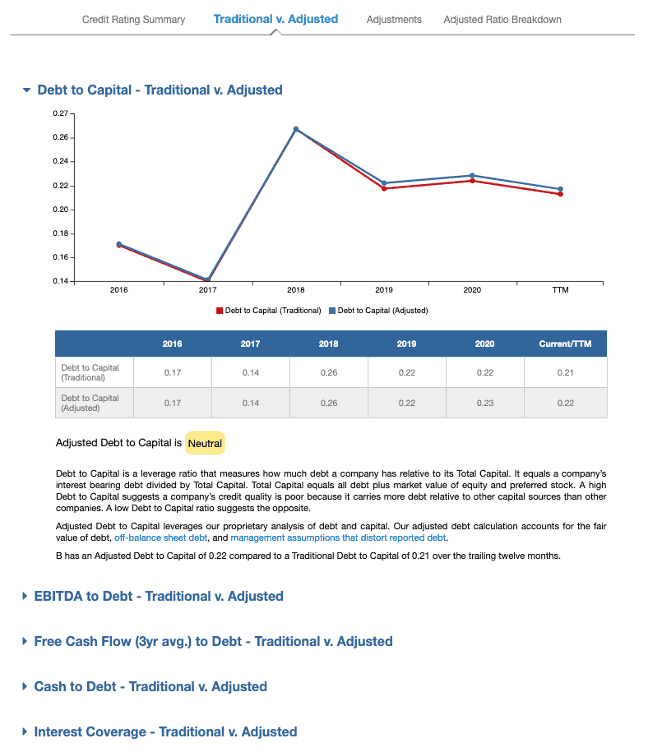
Traditional v. Adjusted Tab
We compare the traditional and adjusted versions of our five Credit Rating ratios over the last five years in charts, and we highlight the biggest adjustments which differentiate our adjusted ratios from traditional ratios. See image below for a sample of this research for the Debt to Capital ratio.
Figure 8: Credit Ratings Traditional v. Adjusted Ratio Details
Sources: New Constructs, LLC
Adjustments Tab
The research here is the same as what you see for our Stock Ratings.
Adjusted Ratio Breakdown Tab
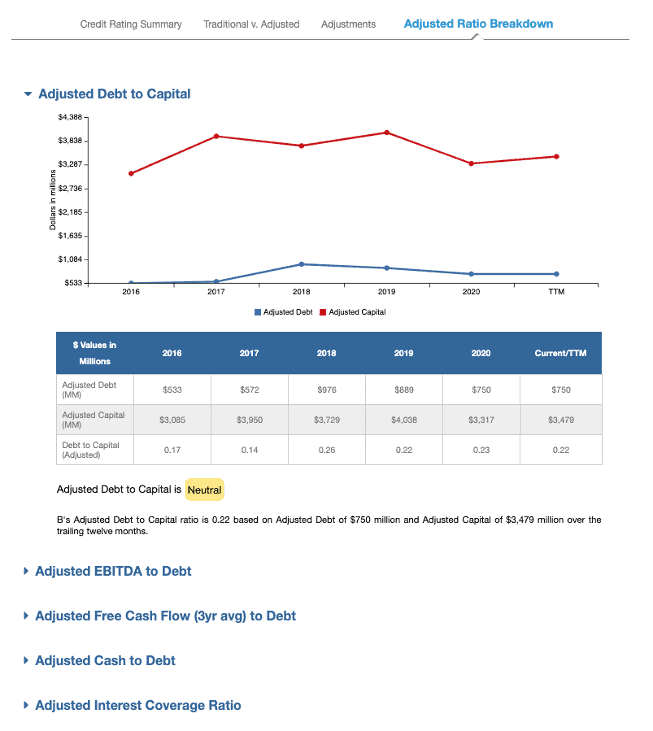
We present the values and a five-year chart for each of the components of the Credit Rating ratios. For example, as shown in the picture below, we provide the values for adjusted debt and adjusted capital, which we use to calculate the Adjusted Debt to Capital ratio. We provide the same granularity for each Credit Rating ratio.
Figure 9: Credit Ratings Adjusted Ratio Breakdown Details
Sources: New Constructs, LLC
This article originally published on December 15, 2020.
Disclosure: David Trainer, Kyle Guske II, Alex Sword, and Matt Shuler receive no compensation to write about any specific stock, style, or theme.
Follow us on Twitter, Facebook, LinkedIn, and StockTwits for real-time alerts on all our research.