
Netflix’s (NFLX: $475/share) second quarter results reaffirm our view that the stock remains highly overvalued and should trade closer to $153/share, instead of its current price of about $440. We were not surprised to see the stock down sharply after the release.
Netflix’s second quarter earnings continue to show that Netflix is a low-growth business with deteriorating profitability, while stock price implies soaring revenue and profits. Netflix’s stock has historically been driven by narrative and sentiment rather than fundamentals, but for those who pay attention to fundamentals, one thing is clear: Netflix is highly overvalued and a very risky investment. See all our past reports on Netflix here.
We believe it’s time for the market to recognize that streaming is a terrible business with high costs, immense competition and very little room for profitability. While Netflix’s platform and content are admirable, we believe investors should look elsewhere for stock opportunities.
What Happened?
During the second quarter of 2023, Netflix missed on the top-line despite a slight beat on bottom-line earnings. Netflix added more subscribers than expected, but average revenue per membership fell year-over-year (YoY) again. Guidance for 3Q23 revenue came in below consensus estimates, which further highlights that Netflix is not the growth story it once was or that is implied by its current valuation, as we’ll show below.
Slowing Growth and Further Price Increases? In 2Q23, Netflix’s revenue grew just 2.8% YoY (below guidance given in 1Q23). 2.8% is well below the long-term goal to “sustain double digit revenue growth” stated in the company’s 4Q22 earnings release. The quarter ahead looks slightly better, as management guided for a 7.5% YoY growth in revenue in 3Q23.
Netflix expects very little improvement in operating margins from 2Q23 to 3Q23 and pointed out that it hasn’t raised prices in its largest markets since the first half of 2022. With the rollout of its paid sharing (shared password crackdown) in full swing, could Netflix look to boost prices again to stoke further margin improvement?
We should hope so because the stock is already pricing in both a significant increase in revenue and margins.
Password Crackdown Only Fixes Past Problems: Netflix finally rolled out its much anticipated “solution” to password sharing in its major markets during 2Q23. Requiring shared password users to migrate to their own account or allowing existing users to share their account for a fee will certainly help boost subscriber numbers in the near-term. However, this action does nothing to drive demand from new users or get old non-active subscribes to pay again. Subscriber growth in the near-term may look great, but Netflix still needs to create new ways to drive user growth beyond tightening the screws on existing users.
Decreased Content Spend Can’t Last: As a leading content creator, Netflix must spend on content to maintain and increase its subscriber base. The company cannot continue cutting content spend if its hopes to keep growing users, as we’ve shown in the past.
Catch 22: Lose $ or Lose Users or Both: If Netflix must increase content spend, it cannot generate positive free cash flow (FCF). Since 2013, Netflix has achieved positive FCF in only two years – 2020 and 2022. Those two years are the only years (since 2013) when Netflix’s content spend declined year-over-year (YoY). See Figure 1. In all other years, when Netflix’s content spend increased, it burned FCF, to the tune of -$13.5 billion in FCF burn since 2013.
Figure 1: Netflix’s Content Spend vs. Free Cash Flow (FCF): 2013 – TTM
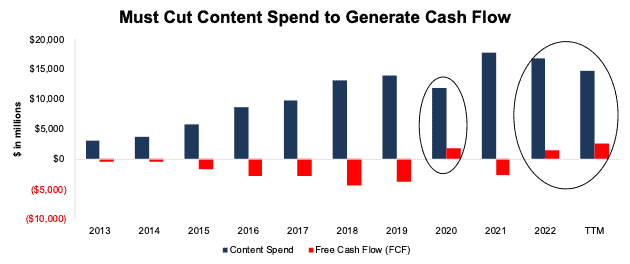
Sources: New Constructs, LLC and company filings
We would expect cash burn to continue moving forward, as the company must increase its content spend to churn out new originals and keep subscribers.
Not only does content spend drive down cash flow, it also seems to be driving down subscriber growth. In the past, content spend seemed to bolster subscriber growth. So, the spend seemed worth it. Figure 2 shows that, outside of the TTM, even when Netflix greatly increases its content spend YoY, subscriber growth is trending lower. Without the password crackdown driven subscriber growth, we doubt subscriber growth would have improved in the TTM.
Figure 2: Netflix’s Content Spend vs. Subscriber Growth: 2014 – TTM
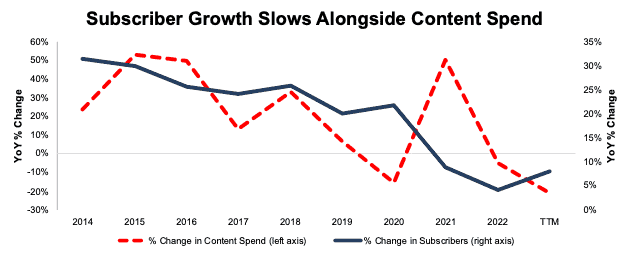
Sources: New Constructs, LLC and company filings
Just Another (Increasingly Expensive) Streamer: While Netflix was once the dominant player in the streaming industry, its recent actions prove that its first-mover advantages are gone. It is now just one of many streaming services. We underestimated Netflix’s ability to raise prices in the past but wonder if there is room for additional price increases moving forward. Consumers now have a dizzying list of alternatives to Netflix, which limits pricing power across the industry. Figure 2 shows Netflix now charges more than all but one (Max) other major streaming services. For reference, we use Netflix’s “Standard” plan and the equivalent packages from competitors in Figure 3.
Figure 3: Netflix Price vs. Streaming Competition
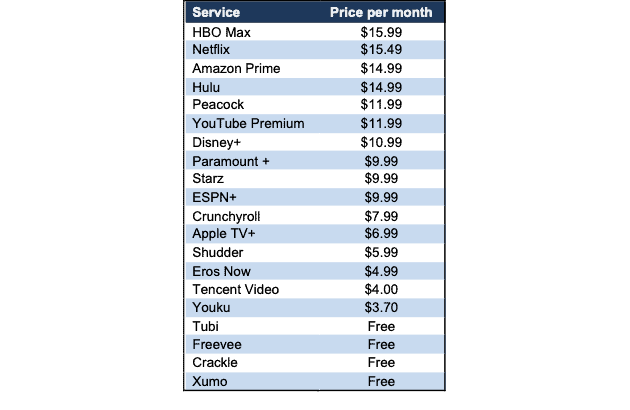
Sources: New Constructs, LLC and company filings
Strikes Make Content More Expensive
While not unique to Netflix, the ongoing writer’s union and actors guild strikes create a challenge to all content creators’ budgets. Striking new labor deals will require paying writers and actors more, whether in direct salary, additional benefits, or both. Increases in content costs lower Netflix’s cash flows, as shown above. In the meantime, while the strikes continue, streaming platforms only have a limited amount of updated content they can distribute, and the longer the strike goes, the greater the risk of users leaving streaming platforms.
What Now?
Netflix remains overvalued, even if difficult to short given its irrational bull runs. 2Q23 earnings, along with the ongoing writers/actors strike, do little to ease concerns that the company can cut content spend, grow customers, and grow cash flows simultaneously. Netflix is a company fighting against competitors with deeper pockets, each of which can use streaming as a loss-leading customer acquisition feature to grow their more profitable operations.
Netflix Priced to be Bigger Than All Major Streaming Competitors
We use our reverse discounted cash flow (DCF) model to quantify the expectations for future profit growth baked into Netflix’s stock price. To justify Netflix’s price of ~$475/share, the company would have to:
- improve NOPAT margin to 18% (previous company high in 2021, compared to 14% over the TTM) and
- grow revenue 20% compounded annually over the next decade (vs. consensus estimates of 8% in 2023, 11% in 2024, and 11% in 2025).
In this scenario, Netflix’s revenue (management’s preferred top-line metric, as opposed to subscriber growth) in 2032 would be $200.7 billion, or 1.2x the combined TTM revenue of Disney (DIS), Fox Corp (FOXA), Paramount Global (PARA), and Warner Bros. Discovery (WBD).
Netflix’s implied NOPAT in this scenario is $35.5 billion in 2032, which would be 2x Amazon’s TTM NOPAT, 5.7x Disney’s TTM NOPAT, and 2.9x Disney’s highest-ever NOPAT, which the company achieved in 2018.
There’s 68% Downside Even If Netflix Maintains Margins
Even if Netflix maintains margins and grows revenue at consensus estimates, the downside is large. Specifically, if we assume:
- NOPAT margin equals 15% (equal to TTM) from 2023 through 2032,
- revenue growth at consensus rates in 2023 (8%), 2024 (11%), and 2025 (11%), and
- revenue grows 11% (continuation of 2025 estimates) each year from 2026 through 2032, then
the stock would be worth just $153/share today – a 68% downside. In this scenario, Netflix’s revenue in 2032 would be $90.4 billion, or 104% of Disney’s TTM revenue and 105% of the combined TTM revenue of Warner Bros, Paramount, and Fox Corp.
Netflix’s implied NOPAT in this scenario, $13.3 billion, would also be 2.1x Disney’s TTM NOPAT and 110% of Disney’s highest NOPAT in 2018.
Figure 4 compares the firm’s historical NOPAT and implied NOPAT for the scenarios above to illustrate the expectations baked into Netflix’s stock price. For reference, we include the TTM NOPAT for Disney, Amazon, and Comcast (CMCSA).
Figure 4: Netflix’s Historical NOPAT vs. DCF Implied NOPAT
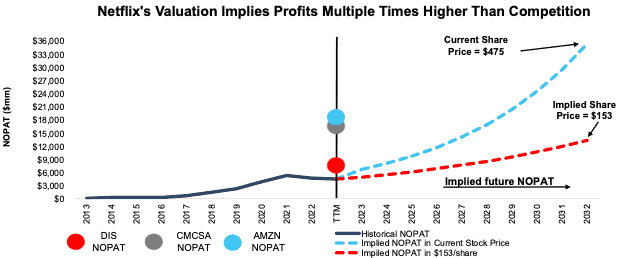
Sources: New Constructs, LLC and company filings
Scenarios Above May Be Too Optimistic
The above scenarios assume Netflix’s YoY change in invested capital is 10% of revenue (equal to 2022) in each year of our DCF model. For context, Netflix’s invested capital has grown 34% compounded annually over the past decade and change in invested capital has averaged 21% of revenue each year over the same time.
It is more likely that change in invested capital will need to be much higher to achieve the growth in the above forecasts, but we use this assumption to underscore the risk in this stock’s valuation. For reference, Netflix’s economic book value, or no growth value, is just $78/share.
This article was originally published on July 20, 2023.
Disclosure: David Trainer, Kyle Guske II, Hakan Salt, and Italo Mendonça receive no compensation to write about any specific stock, sector, style, or theme.
Questions on this report or others? Join our Society of Intelligent Investors and connect with us directly.