
If you’ve read any market news lately, you’ve likely seen OpenAI all over the headlines. First, a $100 billion investment from NVIDIA. Then, 5 new data centers through partnerships with Oracle and SoftBank, which are part of a larger $500 billion initiative. The key takeaway? Massive amounts of capital are flowing into the AI race.
Of course, AI investments are not new, even if the magnitude of each investment seems to rise with each announcement. The influx of capital begs the question, “how can investors take advantage of the AI race when most technology stocks are already overvalued?”
Finding an AI stock that isn’t already overvalued is extremely difficult in today’s market. Difficult, but not impossible.
To find value in the industry, one must look at the infrastructure behind AI. Behind the flash and hype sit massive, power-hungry data centers that require enormous amounts of energy.
Our Long Idea this week is a company that’s well positioned to benefit from the AI data center driven energy demand. The company has industry leading profitability, multiple development agreements in place, and its stock is cheap, unlike most AI tech stocks.
It’s not news that the ongoing race to build massive, power-hungry, data centers will drive strong energy demand in the coming years. It’s also not news that most of the stocks involved in AI and related industries have seen their values explode higher. So, our scoop is that we found a great stock that benefits from AI, but it has been overlooked and remains Attractive. This week’s Long Idea, Black Stone Minerals L.P. (BSM: $13/share), is well positioned to collect royalties all along the way.
We first made Black Stone Minerals a Long Idea in November 2023, and reiterated our bullish opinion on the stock on October 2024. Since our original report, the market has failed to recognize the company’s strong position to benefit from the artificial intelligence (AI) movement. Our original investment thesis on this company remains intact and increasing AI spending makes future growth prospects even more attractive.
BSM presents quality Risk/Reward based on the company’s:
- position to benefit from rising natural gas and steady oil production,
- expanded capacity while maintaining profitability,
- quality yield supported by strong cash flows,
- superior profitability compared to peers, and
- cheap valuation.
What’s Working
Data Centers Drive Huge Energy Demand
Nvidia (NVDA) recently announced a $100 billion investment in OpenAI to help it build data centers to deploy at least 10 gigawatts of NVIDIA’s systems for OpenAI’s AI infrastructure.
What does a deal this big mean for energy consumption? Brian Sullivan of CNBC notes 10 gigawatts is equal to the power generated by:
- 2.5 new nuclear power plants, or
- 15 new giant natural gas plants, or
- 2,700 wind turbines.
This partnership between Nvidia and OpenAI is just one of many examples of AI and data centers driving huge energy demand.
McKinsey projects that by 2030, worldwide data centers will require $6.7 trillion in capital expenditures just to keep pace with the demand for compute power. The International Energy Agency (IEA) projects electricity demand from data centers will more than double by 2030, to ~945 terawatt-hours (TWh), which is slightly more than the entire electricity consumption of Japan.
How We Will Meet the Huge Demand for Energy? Natural Gas
Natural gas is an increasingly attractive power source for two main reasons: reliability and efficiency.
Reliability is paramount for data centers, as outages can result in millions of dollars in lost revenue and significant reputational damage. Natural gas offers a safeguard against traditional energy risks including grid instability, intermittent power supply, and extreme weather events.
Unlike diesel, which is constrained by limited on-site storage and supply chain vulnerabilities, natural gas is delivered continuously via pipelines, which ensures a steady supply even during extended grid outages.
Additionally, natural gas can be quickly turned on and off and has much lower ramp times than solar and wind power.
When selecting a power source, efficiency is also very important to keeping costs low and margins in the green. To measure efficiency, we analyze an energy source’s capacity factor, which measures the actual energy produced relative to the maximum possible energy that could have been produced if operating at peak capacity.
Solar power typically operates at capacity factors between 10% and 25%, while power generated from wind, hydroelectric, coal, and wood sources operate at capacity factors of around 34%, 35%, 43%, and 56%, respectively. Natural gas – combined cycle on the other hand has an average capacity factor of 60%, with some uses, such as combined heat and power (CHP) systems fueled by natural gas operating at capacity factors of 80%. The only energy source that operates at a higher capacity factor then CHP natural gas systems is nuclear energy, at 92%.
The United States is the largest natural gas producer in the world, and the companies that own stakes in natural gas assets are particularly well-positioned to meet the rising needs of data center power consumption.
More specifically, Black Stone Minerals’ management believes “gas-powered electrical generation will cause the next 10 to 15 years of the gas market to not be perfect, but more reliable than it’s been over the past 15 years.”
LNG Exports: Another Driver of Natural Gas Demand
Liquefied natural gas (LNG) exports present another large driver of demand for U.S. natural gas production. LNG provides transportation advantages through the process of liquefying natural gas, which reduces it to 1/600th of its original volume.
U.S. LNG exports have nearly quadrupled over the last five years, and the Energy Information Administration (EIA) forecasts U.S. LNG exports will increase 36% from 2024 to 2026.
Furthermore, the EIA projects U.S. monthly natural gas production to grow from 112.9 billion cubic foot (Bcf) in December 2024 to 115.1 Bcf in December 2026. See Figure 1.
Figure 1: U.S. Monthly Natural Gas Production: 2010 – 2026
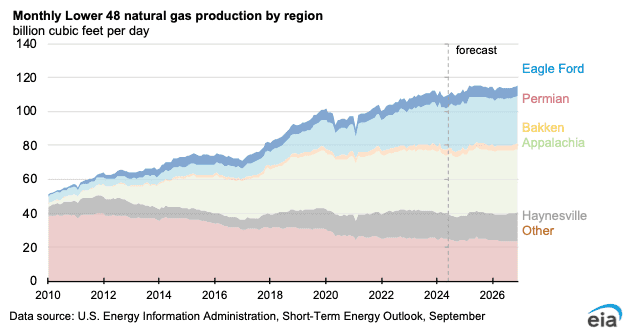
Source: EIA
Oil Production Remains Near Record Highs
U.S. weekly oil production has increased from 9.1 million barrels per day (bpd) in September 2015 to 13.5 million bpd in September 2025. Since October 2023, output has consistently ranged between 13.0 and 13.5 million bpd. See Figure 2.
The EIA projects that U.S. oil production will remain stable near these record levels, averaging 13.4 million bpd in 2025 and 13.3 million bpd in 2026.
Figure 2: U.S. Oil Production: September 2015 – September 2025
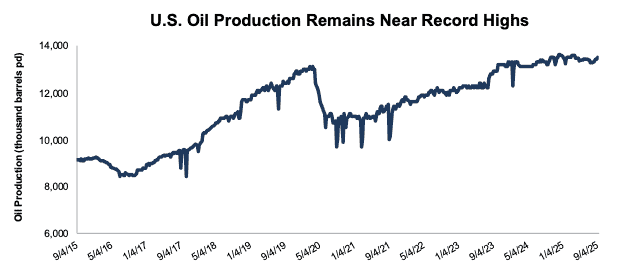
Source: EIA
Large Presence Across All Major Basins
Black Stone Minerals holds mineral rights to 20+ million gross acres across 41 states and 60+ productive basins.
According to the company’s September investor presentation, in 2Q25 BSM maintains rights to 11% of the 571 total rigs in the U.S.
This exposure is spread across all of the major onshore producing basins, which include Haynesville/Bossier, Permian, Bakken, and Eagle Ford basins. See Black Stone Minerals’ acreage presence by region in Figure 3.
Figure 3: Black Stone Minerals’ Acreage by Major Basin in 2024
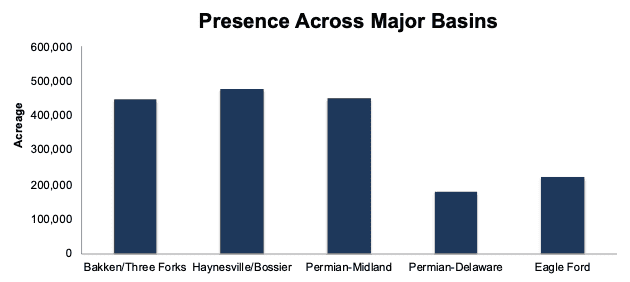
Sources: New Constructs, LLC and company filings
Expanding Natural Gas Production to Meet Growing Demand
Black Stone Minerals’ management team is taking steps to expand its already large asset base to capitalize on growing natural gas production.
In May 2025, Black Stone Minerals entered into a development agreement with Revenant Energy for 270,000 gross acres across the company’s Haynesville/Bossier acreage in the Shelby Through region. Through deal, the annual well commitments escalate over five years from a minimum of 6 wells per year starting in 2026 and scales to a minimum of 25 wells per year. When discussing the agreement on the company’s 2Q25 earnings call, Black Stone Minerals’ CEO noted “these new developments, coupled with our existing agreements, are expected to more than double our drilling obligations in the area over the next 5 years, providing significant natural gas growth for the partnership.”
The company also finalized an amendment with Aethon Energy which will release over 50,000 gross acres back to Black Stone Minerals in the Shelby Through.
These agreements build on the company’s ongoing Haynesville Expansion (HEX) initiative, which extends development in the Shelby Trough and geologically connects to the Western Haynesville. As part of the HEX, the company’s Kurth Lake Expansion (KLX) encompasses 220,000 gross acres with an annual well commitment that escalates from a minimum of 1 well per year starting in 2026 to a minimum of 12 wells per year through 2035.
To summarize, Black Stone Minerals is adding about 50 wells and 50,000 acres of to boost its natural gas production capacity over the next ten years.
Special Business Model
As we highlighted in our previous reports, Black Stone Minerals generates revenue by leasing its mineral and royalty interests in oil and gas properties across the U.S. The company does not bear the costs or operational risks associated with drilling or maintaining wells. Instead, it leases its rights to exploration and production (E&P) companies, which assume the associated expenses and risks.
This business model allows Black Stone Minerals to benefit from rising natural gas and oil production in a much more stable and predictable manner compared to E&P companies.
Profits Trending Up in the Long-Term
While profits are down from record 2022 levels, Black Stone Materials continues to generate strong Core Earnings and free cash flow (more on that later). Black Stone Minerals generated $245 million in Core Earnings in the TTM ended 2Q25, which is higher than any other year in our model except 2022 and 2023.
Black Stone Minerals has grown revenue by 1% compounded annually and Core Earnings by 7% compounded annually since 2015. See Figure 4.
More recently, the company’s net operating profit after-tax (NOPAT) margin improved from 48% in 2019 to 64% in the TTM, and in turn its return on invested capital (ROIC) improved from 11% to 17% over the same time.
Figure 4: Black Stone Minerals’ Revenue and Core Earnings: 2015 – TTM
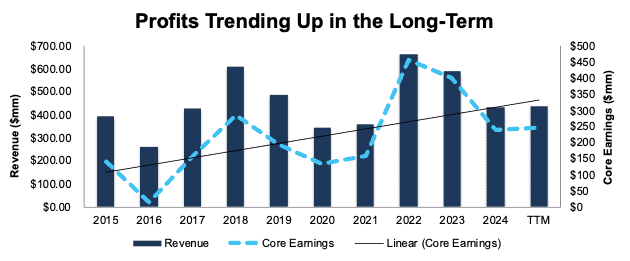
Sources: New Constructs, LLC and company filings
Consistent Cash Flows Support Distributions
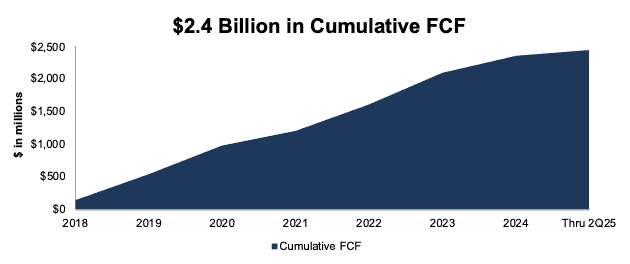
Black Stone Minerals’ rising free cash flow (FCF) remains impressive. It gives the company the means to expand production and support an increasing level of capital return to shareholders as highlighted below. The company generated a cumulative $1.9 billion in FCF while paying $1.6 billion in combined distributions ($1.5 billion) and common unit repurchases ($23 million) since 2020.
Black Stone Minerals generated a cumulative $2.4 billion (78% of enterprise value) in FCF from 2018 through 2Q25. See Figure 5.
Figure 5: Black Stone Minerals’ Free Cash Flow: 2018 – 2Q25
Sources: New Constructs, LLC and company filings
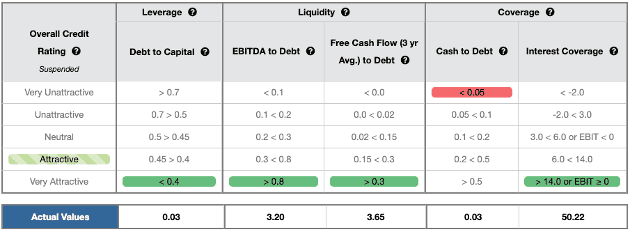
Strong Balance Sheet
Black Stone Minerals reduced its total debt from $399 million in 2019 to $100 million in the TTM. The company earns an Attractive Credit Rating in part because of its reduced debt load and consistent cash flows. Black Stone Minerals earns a Very Attractive rating in four of the five criteria that drive our Credit Ratings. Even if economic conditions deteriorate, the company’s strong financial footing secures its operations for the foreseeable future.
Figure 6: Black Stone Minerals’ Credit Rating Details
Sources: New Constructs, LLC and company filings
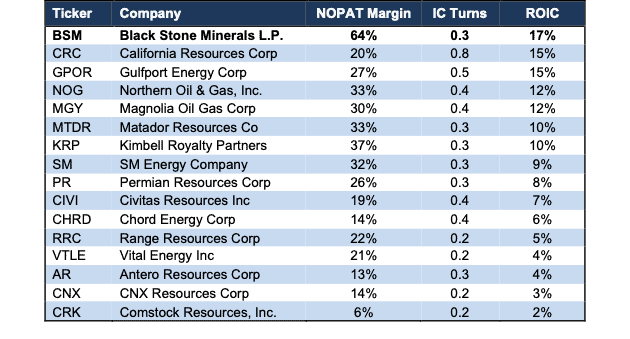
Industry Leading Profitability
Black Stone Materials’ superior profitability compared to its peers reflects just how strong the oil and gas royalty business is.
Per Figure 7, Black Stone Minerals generates the highest ROIC and NOPAT margin of its peer group. The peer group, detailed in Black Stone Minerals’ proxy statement, includes California Resources (CRC), Gulfport Energy (GPOR), Northern Oil & Gas (NOG), Magnolia Oil & Gas (MGY), and more.
Figure 7: Black Stone Minerals’ Profitability Vs. Peers: TTM
Sources: New Constructs, LLC and company filings
Potential for 9.4%+ Yield
Black Stone Minerals has consistently returned capital to shareholders for nearly a decade. The company increased its regular distribution from $0.08/unit in 2Q20 (lows of COVID-19) to $0.30/unit in 3Q25. When annualized, the current regular distribution provides investors a 9.3% yield.
From 2020 through 2Q25, Black Stone Minerals paid $1.5 billion (56% of current market cap) in regular distributions.
Black Stone Minerals also repurchases units, though in lower amounts relative to distributions. Black Stone Minerals repurchased a total of $23 million in units since 2020. As of June 30, 2025, the company had $150 million remaining in repurchase authorization.
Should the company continue repurchasing units at TTM levels moving forward, it would repurchase units worth 0.1% of its current market cap. When combined with distributions, investors could see a yield of 9.4%.
What’s Not Working
Lower Oil Prices Are a Drag
Oil prices declined in the first half of 2025 due to weakening global demand amid changes in trade policies and escalating trade tensions, alongside a significant supply increase as OPEC+ members unwound voluntary production cuts and non-OPEC+ producers increased output.
The company’s realized oil and condensate price was $67.07/Bbl in 1H25, compared to $77.35/Bbl in 1H24 and $98.34/Bbl in 1H22. Lower oil prices drove the company’s oil and condensate sales down 27% YoY in 1H25. Oil prices are forecasted to continue to decline into early 2026, which will continue to put pressure on Black stone Minerals’ oil and condensate sales.
However, rising natural gas prices have offset the decline in oil prices. The company’s realized natural gas price was $3.66/Mcf in 1H25, compared to $2.39/Mcf in 1H24. The increase in prices drove natural gas and NGL sales 33% higher YoY in 1H25. Total revenue in 1H25 increased 2% YoY. Furthermore, natural gas prices are projected to rise going into next year, from $2.91 per million British thermal units (MMBtu) in August 2025 to $4.30 MMBtu in 2026.
The good news is even if natural gas prices were to increase less than expected or oil prices were to fall, any downside to profits is already more than priced into Black Stone Minerals’ current stock price.
Current Price Implies Drastic Margin Deterioration
At its current price of $13/share, Black Stone Minerals has a price-to-economic book value (PEBV) ratio of 0.7, which means the market expects its profits to permanently fall 30% from current levels. Below, we use our reverse discounted cash flow (DCF) model to quantify the cash flow expectations for different stock price scenarios for BSM.
In the first scenario, we quantify the expectations baked into the current price. If we assume:
- NOPAT margin falls to 42% (below TTM margin of 64% and 10-year average margin of 50%),
- revenue grows at consensus rates in 2025 (-1%) and 2026 (9%), and
- revenue grows just 1% each year thereafter through 2034 (equal to compound annual growth since 2015), then
BSM would be worth $13/share today – equal to the current stock price. In this scenario, Black Stone Minerals’ NOPAT would fall 3% compounded annually through 2034. For reference Black Stone Minerals has grown NOPAT by 7% compounded annually since 2015.
Shares Could Go 50%+ Higher
If we instead assume:
- NOPAT margin immediately falls to 61% (equal to 5-year average),
- revenue grows at consensus rates in 2025 (-1%) and 2026 (9%), and
- revenue grows just 1% each year thereafter through 2034, then
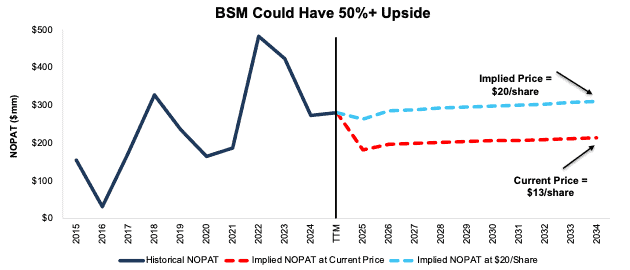
BSM would be worth at least $20/share today – a 54% upside to the current price. In this scenario, Black Stone Minerals’ NOPAT would grow just 1% compounded annually over the next decade.
Should Black Stone Minerals grow profits more in line with historical rates, the stock has even more upside. Figure 8 compares Black Stone Minerals’ historical NOPAT to the NOPAT implied in each of the above DCF scenarios.
Figure 8: Black Stone Minerals’ Historical and Implied NOPAT: DCF Valuation Scenarios
Sources: New Constructs, LLC and company filings.
This article was originally published on September 24, 2024.
Disclosure: David Trainer, Kyle Guske II, and Hakan Salt receive no compensation to write about any specific stock, sector, style, or theme.
Questions on this report or others? Join our online community and connect with us directly.