This report focuses on my top picks and pans for all sector funds. I will follow this summary with a detailed report on each sector. More on how New Constructs tackles “big data” in footnotes to deliver proper due diligence in research.
My top ETFs and mutual funds have high-quality holdings and low costs. As detailed in “Low-cost funds dupe investors”, there are few funds that have both good holdings and low costs. While there are lots of cheap funds, there are very few with high-quality holdings.
I think there are at least two causes for this disconnect. First, there is, in general, a lack of independent research on ETFs and funds. Second, I think it is fair to say that there is a severe lack of quality research into the holdings of mutual funds and ETFs. There should not be such a large gap between the quality of research on stocks and funds, which are simply groups of stocks.
After all, investors should care more about the quality of a fund’s holdings than its costs because the quality of a fund’s holdings is the single most important factor in determining its future performance.
My Predictive Rating system rates 7400+ ETFs and mutual funds according to the quality of their holdings (Portfolio Management Rating) and their costs (Total Annual Costs Rating).
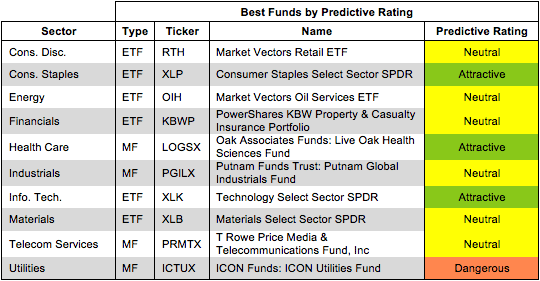
Figures 1 shows the best ETF or mutual fund in each sector as of 4/10/13.
For a full list of all ETFs and mutual funds for each sector ranked from best to worst, see my free ETF & mutual fund screener.
Figure 1: Best ETF or Mutual Fund In Each Sector
 Source: New Constructs, LLC and company filings
Technology Select Sector SPDR (XLK) is my top-rated Information Technology ETF and earns my Attractive rating. It earns this rating by allocating over 32% of its value to Very Attractive rated stocks.
Microsoft Corporation (MSFT) is one of my favorite stocks held by XLK and earns my Very Attractive rating. Many analysts are bearish on MSFT due to recent reports of a declining PC market, but they ignore the strong underlying financial position of the company. Microsoft has maintained a consistently high return on invested capital (ROIC). Its 2012 ROIC of 71% ranks in the top 10 of all companies in the S&P 500. In contrast, the valuation of the stock is one of the cheapest in the S&P500. At ~$30.28/share, MSFT has a price to economic book value ratio of 0.6. This ratio means that the market is predicting a permanent 40% decline in MSFT’s after tax profit (NOPAT). Microsoft’s business is more than just PC’s, and its $71 billion in excess cash gives it the resources to fund innovation and establish itself in new markets. The PC industry may be in trouble, but MSFT is much better off than its stock price suggests.
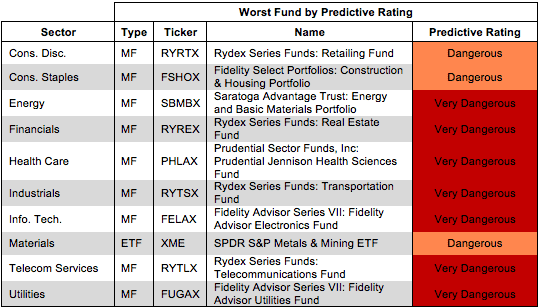
Figure 2 shows the worst ETF or mutual fund for each sector as of 4/10/13.
Dangerous-or-worse-rated funds have a combination of low-quality portfolios (i.e. they hold too many Dangerous-or-worse rated stocks) and high costs (they charge investors too much for the [lack of] management they provide).
Figure 2: Worst ETF or Mutual Fund In Each Sector
 Source: New Constructs, LLC and company filings
Fidelity Advisor Series VII: Fidelity Advisor Electronics Fund (FELAX) is my worst rated Information Technology Mutual Fund. It earns this rating by allocating over 56% of its value to Neutral-or-worse rated stocks. It also charges investors total annual costs of 4.65%.
Broadcom Corporation (BRCM) is one of my least favorite stocks held by FELAX and earns my Dangerous rating. BRCM bought NetLogic Microsystems for $3.7 billion in 2011, and the acquisition does not seem to be paying off so far. BRCM’s NOPAT decreased by a total of 18% from 2010 to 2012. Declining profits, combined with the significant increase in invested capital necessitated by the acquisition, drove BRCM’s ROIC down by 4% in 2012. Despite this downward trend in profitability, BRCM is optimistically priced at ~$33.88/share. This valuation implies 9% growth in NOPAT compounded annually for 11 years. BRCM could reverse its current trend of declining profitability, but the gap between its performance and the market expectations makes it a risky investment at the moment.
Heavy allocation to BRCM helps to explain why FELAX is my worst rated Information Technology mutual fund. The performance of a fund is only as good as the performance of its holdings. A fund that holds poor performing stocks is going to perform poorly.
Traditional mutual fund research has focused on past performance and low management costs. The quality of a fund’s holdings has been ignored. Our Portfolio Management Rating examines the fund’s holdings in detail and takes into account the fund’s allocation to cash. Our models are created with data from over 50,000 annual reports. This kind of due diligence is necessary for understanding just what you are buying when you invest in a mutual fund or an ETF.
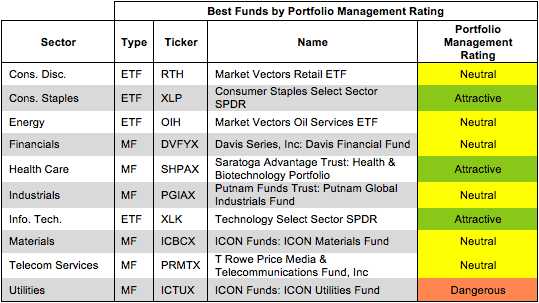
Figure 3 shows the best ETF or mutual fund based on our Portfolio Management Rating for each sector as of 4/10/13.
Attractive-or-better-rated funds own high-quality stocks and hold very little of the fund’s assets in cash – investors looking to hold cash can do so themselves without paying management fees. Only 2% of funds receive our Attractive or Very Attractive Portfolio Management ratings, so investors need to be cautious when selecting a sector mutual fund or ETF – 568 funds earn my Dangerous-or-worse-rating.
Figure 3: ETF or Mutual Fund With Highest Quality Holdings by Sector
 Source: New Constructs, LLC and company filings
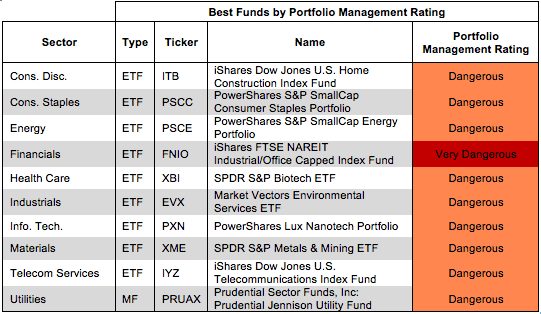
Figure 4 shows the worst ETF or mutual fund based on our Portfolio Management Rating for each sector as of 4/10/13.
Many ETFs and mutual funds managers do a poor job identifying quality stocks. These funds are not worth owning at any cost.
Figure 4: ETF or Mutual Fund With Lowest Quality Holdings by Sector
 Source: New Constructs, LLC and company filings
Investors should care about all of the fees associated with a fund in addition to the quality of the fund’s holdings. The best ETFs and mutual funds have both low costs and quality holdings – and there are plenty of low cost funds available to investors.
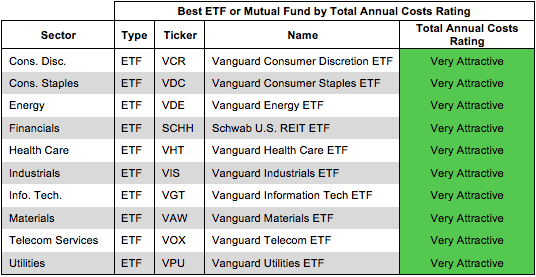
Figure 5 shows the best ETF or mutual fund in each sector according to our Total Annual Costs Rating.
Total Annual Costs incorporates all expenses, loads, fees, and transaction costs into a single value that is comparable across all ETFs and mutual funds. Passively managed ETFs and index mutual funds are generally the cheapest.
Figure 5: ETF or Mutual Fund With Lowest Costs by Sector
 Source: New Constructs, LLC and company filings
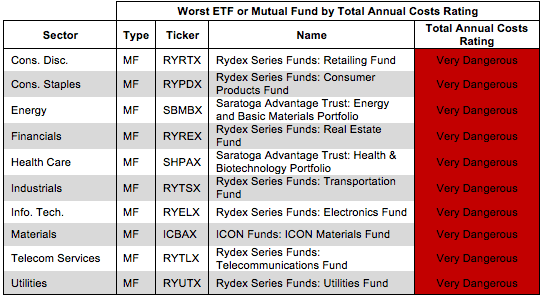
Figures 6 shows the worst fund in each sector according to our Total Annual Costs Rating.
The most expensive fund for each sector has a Very Dangerous Total Annual Costs Rating. Investors should avoid these funds and other funds with Very Dangerous Total Annual Costs Ratings because they charge investors too much. For every fund with a Very Dangerous Total Annual Costs Rating there is an alternative fund that offers similar exposure and holdings at a lower cost. We cover over 7000 mutual funds and over 400 ETFs and the ratings of each can be found at our free ETF & mutual fund screener. Investors have plenty of alternatives to these over priced funds.
Figure 6: ETF or Mutual Fund With Highest Costs by Sector
 Source: New Constructs, LLC and company filings
Rydex Series Funds, provided by Guggenheim Investment Funds, make up the most expensive funds in seven out of the ten sectors.
Sam McBride contributed to this report.
Disclosure: David Trainer owns MSFT. David Trainer and Sam McBride receive no compensation to write about any specific stock, sector or theme.
3 replies to "Rating Breakdown: Best & Worst ETFs & Mutual Funds by Sector (April 2013)"
how does your predictive data rate funds with good risk adj historical long term perfromance– eg – yachtman, BBTEX, Seqouia, in lg cap– and RYSEX and Brown in small cap, and First eagle in golbal alloc, and mAPIX in EM?
and PAUDX,, and templeton global bonds??
thanks marvin
Mr. Menzin,
Historical performance does not factor into my ratings of funds in any way. How a fund has performed in the past does not determine how it will perform in the future. Only quality holdings can create value, so my ratings of funds are driven by my ratings of the stocks they hold. This is why I cover only equity ETFs and mutual funds.
Thanks for your comment,
David Trainer
Interesting information #1..How well is the N/C results compared the S&P 500 Benchmark? #2.Are stop orders signaled ..like below 50 or 100 day moving avg ?Is your best results – trading stocks or funds?#3. Unfortunately,you have a wide variety of investment opportunities .. Sectors…ETF’s etc so am finding it difficult to choose from your presentations–Sector rotation is of most interesting to me.#4 Can you explain your subscription fee structure.. Thanks