Return on invested capital (ROIC) is not only the most intuitive measure of corporate performance, but it is also the best. It measures how much profit a company generates for every dollar invested in the company.
Return on gross invested capital (ROGIC) (seen in Figure 1) provides additional insights into the profitability of highly-capital intensive businesses. Depreciation policies may differ from firm to firm and can have a significant impact on both NOPAT and invested capital. ROGIC helps to minimize the impact of different depreciation policies and asset write-down policies.
Properly calculating ROIC, the primary driver of stock prices, is key to measuring a firm’s ability to generate returns on the capital invested in its business. Our Robo-Analyst technology allows us to perform the diligence needed to calculate an accurate ROIC and comparable metrics, such as ROGIC and GAAP-based ROIC.
Figure 1: How To Calculate Return on Gross Invested Capital (ROGIC)
Gross NOPAT / Average Gross Invested Capital
where
Gross NOPAT = (Net Operating Profit Before Tax + Depreciation and Amortization) * (1- Income Tax Rate)
Gross Invested Capital = Net Working Capital + Adjusted Fixed Assets + Accumulated Depreciation and Amortization
Sources: New Constructs, LLC
We make it easy for the average investor to leverage the benefits of a high quality ROIC model and see a clear picture of a firm’s true profitability. Figure 2 shows the Large Cap Energy companies with the highest and lowest ROGICs.
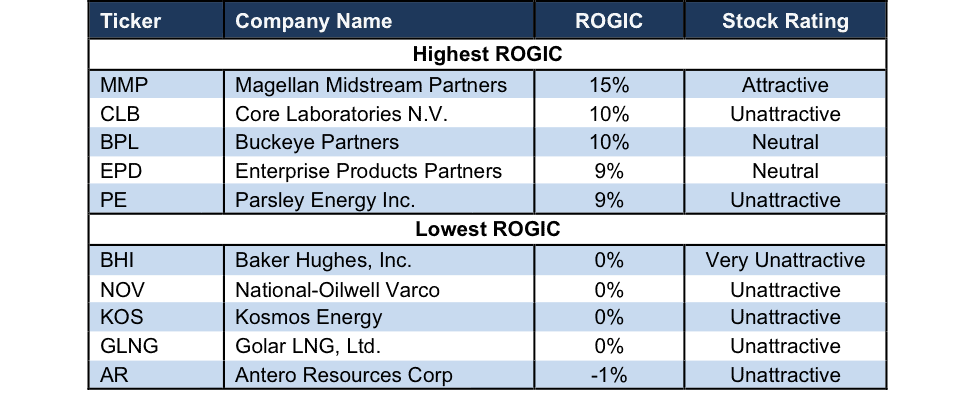
Figure 2: Large Cap Energy Companies With Highest/Lowest ROGIC Over Last Twelve Months
Sources: New Constructs, LLC and company filings.
Magellan Midstream Partners’ (MMP) 15% ROGIC is the highest of all Large Cap Energy companies under coverage. Magellan has earned a positive ROGIC since 2012. See Magellan’s ROGIC each year dating back to 2012 here.
Core Laboratories N.V. (CLB), Buckeye Partners (BPL), Enterprise Products Partners (EPD), and Parsley Energy (PE) earn the second through fifth highest ROGIC. However, ROGIC alone doesn’t mean a company earns an Attractive-or-better rating. Core Laboratories and Parsley Energy both earn an Unattractive rating. See CLB’s ROGIC each year dating back to 2010 here.
Antero Resources Corp (AR) earns the lowest ROGIC of all Large Cap Energy companies under coverage. Golar LNG (GLNG), Kosmos Energy (KOS), National-Oilwell Varco (NOV), and Baker Hughes (BHI) round out the five lowest ROGIC’s across the Large Cap Energy sector. Baker Hughes’ ROGIC has fallen from 8% in 2014 to 0% TTM. See BHI’s ROGIC since 2011 here. We include $1.2 billion (5% of market cap) in depreciation and amortization costs when calculating Baker Hughes’ ROGIC.
Our models and calculations are 100% transparent because we want our clients to know how much work we do to ensure we give them the best earnings quality and valuation models in the business. Providing multiple versions of a given metric is part of this transparency. We customize calculations and metrics for clients as much as they see fit. We are not in the business of selling any one particular methodology. Our focus is on providing clients with a higher quality data set with which to perform calculations with integrity across thousands of stocks, ETFs and mutual funds.
This article originally published on May 30, 2017.
Disclosure: David Trainer and Kyle Guske II receive no compensation to write about any specific stock, style, or theme.
Follow us on Twitter, Facebook, LinkedIn, and StockTwits for real-time alerts on all our research.