
Breaking return on invested capital (ROIC) into NOPAT Margin and Average Invested Capital Turns provides insights into the operating vs. capital efficiency of businesses, aka DuPont Analysis.
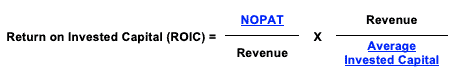
NOPAT/Revenue is the NOPAT Margin, which measures the operating efficiency of businesses. Revenue/Average Invested Capital equals Average Invested Capital Turns, which measure the capital efficiency of businesses.
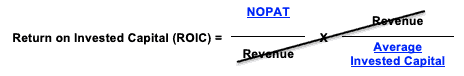
When you multiply the NOPAT Margin by Invested Capital Turns, Revenue cancels out, and we have NOPAT/Average Invested Capital or ROIC.
Clients get access to the ROIC Drivers for every stock in their portfolios with us.
Companies with similar ROICs can have very different business models and only by analyzing NOPAT margin and invested capital turns can we determine where there may be the most opportunity for improvement.
Analyzing Efficiency Differences Between Two Industries
Figure 1 shows that Lowe’s Corporation (LOW) and Simon Property Group (SPG), two firms in different industries, have the same 12% ROIC. How they generate that ROIC is vastly different.
Figure 1: Business Efficiency Across Industries: SPG vs. LOW - TTM as of September 16, 2019
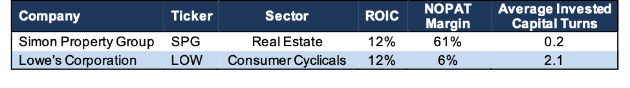
Sources: New Constructs, LLC and company filings
SPG is a real estate investment trust that owns mall and outlet mall properties across the country. Lowe’s is a retailer selling home-improvement products to consumers.
SPG invests heavily in property, such as shopping, dining, entertainment, and mixed-use buildings. This business model focuses on exacting rents from its capital. Lowe’s Corporation, on the other hand, focuses on selling goods consumers.
Per Figure 1, SPG is much less efficient at converting invested capital into revenue, per its 0.2 average invested capital turns compared to 2.1 for LOW. In other words, SPG generates $0.20 of revenue for every $1 of capital invested into its business. LOW generates $2.1 of revenue for every $1 invested into its business.
Accordingly, despite similar levels of invested capital ($28.5 billion for SPG vs. $32.7 billion for LOW), SPG generated just $5.7 billion in revenue over the trailing twelve month (TTM) period while LOW generated upwards of $71.8 billion.
While SPG is much less capital efficient, it is much more operationally efficient and boasts a much higher NOPAT margin (61%). Per Figure 1, we see that SPG converts 60% of its revenue into NOPAT, compared to just 6% for LOW. This discrepancy means that despite generating 92% less revenue than LOW, SPG generated just 13% less NOPAT over the TTM period.
Because SPG collects rents from the same assets over many years, it needs higher margins to achieve a high ROIC. Lowe’s, on the other hand, is competing with many other retailers, largely on price, such as The Home Depot (HD), Walmart (WMT) and even Amazon (AMZN); so it needs to achieve higher capital turns to earn a high ROIC.
ROIC Drivers Provide Insights Within the Same Industry
Per Figure 2, Yum China Holdings (YUMC) and McDonald’s Corporation (MCD), both fast food giants, have similar ROICs but vastly different NOPAT margin and invested capital turns.
Figure 2: Business Efficiency in the Same Industry: YUMC vs. MCD – TTM as of September 16, 2019
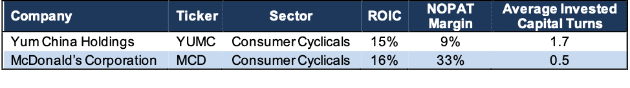
Sources: New Constructs, LLC and company filings
Yum China generates $1.70 of revenue per $1 of capital invested into its business while McDonald’s generates less than one-third, or $0.50 of revenue per $1 of invested capital.
On the other hand, McDonald’s, with its global brand and supply chain efficiency, converts an impressive 33% of its revenue into NOPAT compared to just 9% for Yum China.
Yum China is much more capital efficient while McDonald’s is more operationally efficient. These businesses are far more different than they seem when just looking at ROIC.
We provide our clients with the drivers of ROIC as well as all the adjustments we make to calculate the most accurate NOPAT and Invested Capital for every stock, ETF and mutual fund we cover.
Whatever the level of ROIC, investors benefit from (1) an accurate measure of ROIC and (2) knowing the drivers of ROIC.
Figure 3 comes from our detailed reports on the importance of ROIC to valuation. Nearly every single activity within a for-profit business can be linked back to ROIC and free cash flow. We believe investors deserve to know how businesses work, which means how they make money. Whenever executives claim there is strategic “value” in any of their decisions, they should show investors exactly how that value is created. Figure 3 provides a road map for showing how value is created in a company.
Figure 3: How Businesses Create Value
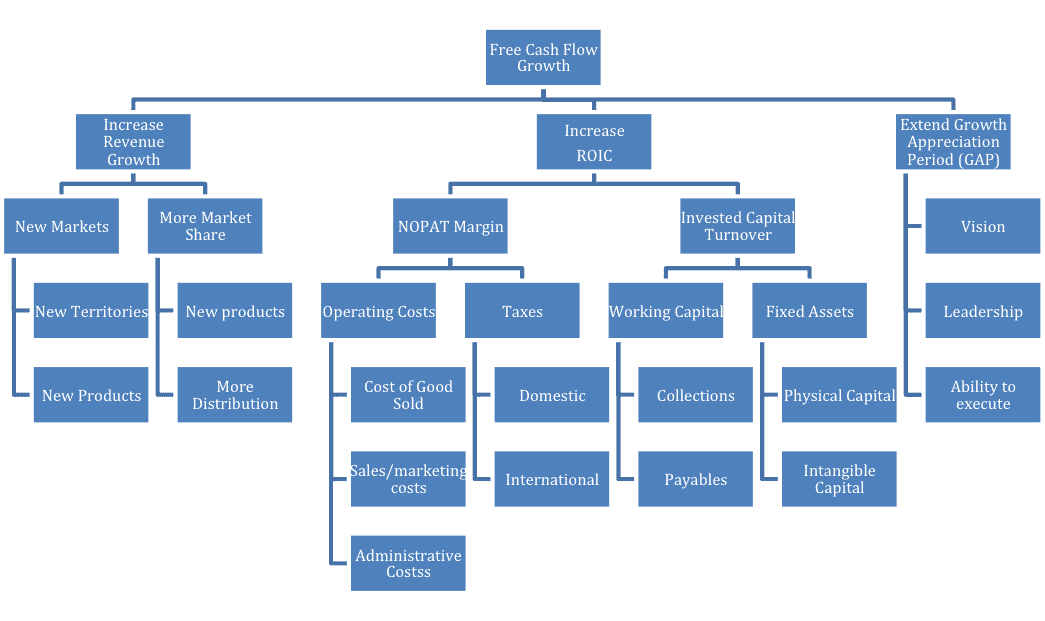
Sources: New Constructs, LLC and company filings
Our models and calculations are 100% transparent because we want our clients to know how much work we do to ensure we give them the best earnings quality and valuation models in the business.
This article originally published on September 16, 2019.
Disclosure: David Trainer and Kyle Guske II receive no compensation to write about any specific stock, sector, style, or theme.
Follow us on Twitter, Facebook, LinkedIn, and StockTwits for real-time alerts on all our research.