Check out this week’s Danger Zone interview with Chuck Jaffe of Money Life and Marketwatch.com
We’ve previously put the Small Cap Blend style in the Danger Zone, and the time has come to take a look at the entire Small Cap style. The three lowest-rated investment styles in our 3Q15 Style Ratings for ETFs and Mutual Funds are, starting with the worst, Small Cap Blend, Small Cap Growth, and Small Cap Value. These three styles have made up the bottom of our quarterly rankings since 2Q14. Over this time, the Small Cap style (as measured by the Russell 2000) is up 12% while the S&P 500 is up 14%.
Don’t Succumb To Peer Pressure: Chasing Returns Is a Bad Idea
While the return between Small Cap stocks and Large Cap stocks has not been that different for little over a year, the past few months have proved otherwise. Since October 2014, the Russell 2000 is up 16% and the S&P 500 is up 9%. This outperformance has led to record inflows into the Small Cap style. In June, the iShares Russell 2000 (IWM) had inflows of $3.7 billion, which would make June the biggest month of inflows since September 2008. On the other hand, according to ETF.com, the SPDR S&P 500 (SPY) saw outflows of $1.7 billion in June. Investors are chasing returns and piling into the small cap style even though most know that past performance is no indicator of future success.
Overvalued, Low Quality Stocks
Investors are ignoring the risk when they throw money into the Small Cap style. Stocks in this style have become significantly overvalued as more speculators pile on the chase.
As of July 17, 2015, the average positive price to economic book value (PEBV) ratio for the Russell 2000 is 3.6 compared to 2.2 for the S&P 500. This ratio implies that the market expects the profits for the Russell 2000 to increase 360% from their current levels versus just 220% for the S&P 500.
One might argue that market expectations are higher because of the greater potential of Small Cap stocks relative to Large Cap. This phenomenon may be true, but investors may not realize how much more growth expectation is already baked into Small Cap market valuations. The average growth appreciation period (GAP) of the Russell 2000 is 42 years compared to 20 years for S&P 500. In other words, the market expects Small Cap stocks to grow profits and earn a return on invested capital (ROIC) greater than weighted average cost of capital (WACC) for 22 years longer than for Large Cap stocks. This expectation conflicts with the fact that companies in the Russell 2000, with an average ROIC of 7%, tend to have much weaker business models and higher barriers to entry than companies in the S&P 500, with an average ROIC of 22%. This difference is why the more established and competitively proven companies have become Large Cap and the newer, unproven, or competitively challenged companies remain Small Cap.
Poor Stocks Create Poor Funds
Investors are flocking to an investment style that, apart from being overvalued, simply doesn’t contain many quality stocks. As shown in Figure 1, only 9% of the stocks covered in the Russell 2000 receive an Attractive-or-better rating compared to 20% of the S&P 500. With so few quality stocks to choose from, it’s no surprise that ETFs and mutual funds are just as bad when it comes to allocating to stocks. See our Predictive ETF & Mutual Fund Ratings methodology here.
Figure 1: Small Cap Stocks Lack Quality
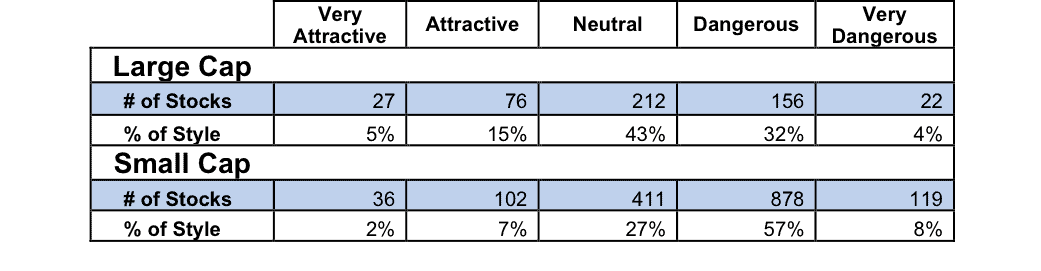
Sources: New Constructs, LLC and company filings.
As can be seen in Figure 2, there are only 2 (4% of style) Attractive-or-better rated Small Cap ETFs compared to 91 (78% of style) Large Cap ETFs. Additionally, Investors have failed to identify the Attractive rated Small Cap ETFs as over 90% of total net assets (TNA) are in ETFs that receive our Dangerous rating. Large cap investors have allocated assets more intelligently into the more highly-rated funds.
Figure 2: Small Cap ETFs Compared to Large Cap ETFs
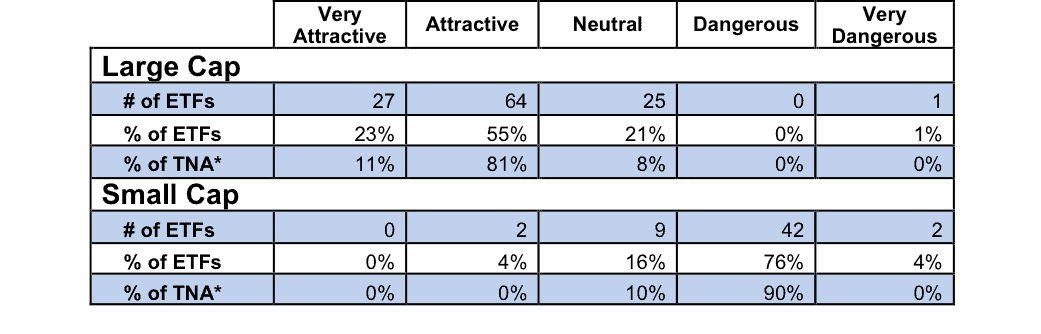
Sources: New Constructs, LLC and company filings. “TNA” stands for “Total net Assets”
The picture is no better when looking at mutual funds in both investment styles. As seen in Figure 3, there are only 18 (1% of style) Attractive-or-better rated Small Cap mutual funds compared to 1375 (59% of style) Large Cap mutual funds. As we saw with ETFs, investors have put majority (71% of TNA) of their money into Small Cap fund with a Dangerous-or-worse rating. Large cap investors have allocated assets more intelligently into the more highly-rated funds.
Figure 3: Small Cap MFs Compared to Large Cap MFs
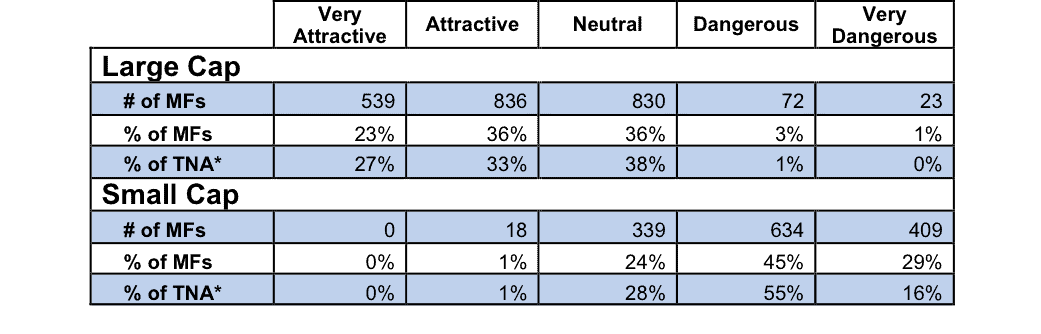
Sources: New Constructs, LLC and company filings. “TNA” stands for “Total net Assets”
High Costs Only Make Matters Worse
With such poor stock picking on the part of ETF and mutual fund managers in the Small Cap style, investors should not be paying a premium but unfortunately they are when investing in this style. The average total annual costs of ETFs and mutual funds across all styles is 1.9%, while the average for the Small Cap style is actually higher at 2.2%.
Bright Spots to Be Found
Despite the poor stocks, ETFs, and mutual funds in the Small Cap style, there are still quality investing opportunities available. Royce Special Equity Fund (RSEFX) is the top rated Small Cap Value mutual fund and earns our Attractive rating. It earns this rating by allocating over 60% of assets to Neutral-or-better rated stocks (compared to 31% Neutral-or-better in the benchmark IWM) and charging below average total annual costs of 1.66%.
Janus Investment Perkins Small Cap Value Fund (JDSNX) is another one of the top rated Small Cap Value mutual funds and earns our Attractive rating. JDSNX allocates over 58% of assets to Attractive-or-better rated stocks and charges total annual costs of only 0.95%.
For more details on which funds rank the best and worst in large cap and small cap styles, see our individual reports on those styles. Last quarter’s reports on each style are here.
The Worst Offenders of the Style
The following funds are the three lowest rated ETFs or mutual funds across the Small Cap investment style.
- AllianzGI Ultra Micro Cap Fund (GUCAX) – 53% of assets allocated to Dangerous-or-worse rated stocks and total annual costs of 5.11%.
- Alpine Series small Cap Fund (ADIAX) – 58% of assets allocated to Dangerous-or-worse rated stocks and total annual costs of 5.50%.
- Investment Managers Chartwell Small Cap Value Fund (CWSVX) – 62% of assets allocated to Dangerous-or-worse stocks and total annual costs of 5.22%.
Disclosure: David Trainer and Kyle Guske II receive no compensation to write about any specific stock, style, or theme.