
Similar to 1Q21, misleading earnings beats continue in 2Q21. Operating Earnings from S&P Global (SPGI) exaggerated the drop in 2020 and are overstating the rebound in S&P 500 earnings over the last five months. The same is true for I/B/E/S Street Earnings for individual companies.
This report shows:
- why Street Earnings (and GAAP earnings) are flawed
- five S&P 500 companies with overstated Street Earnings and a Very Unattractive Stock Rating
- how Core Earnings and our Earnings Distortion factor generate alpha
Over 200 S&P 500 Firms Overstate EPS by More than 10%
Per Figure 1, 75% of the S&P 500 companies have overstated Street EPS over the trailing twelve months (TTM) through 2Q21[1]. 43% have overstated EPS by more than 10%. Overall, when companies overstate, earnings they do so by an average of 23%.
Figure 1: Street Earnings Overstate Earnings for 375 S&P 500 Companies[2]

Sources: New Constructs, LLC and company filings.
S&P Global’s Earnings Rebound Is Misleading
In theory, Wall Street analysts and research firms create adjusted earnings measures like Street Earnings and Operating Earnings to exclude unusual gains and losses. In reality, these adjusted earnings measures rarely, if ever, fully capture unusual items, which have a very material impact on results.
Per Figure 2 (from our report S&P’s “Operating Earnings” Remain Overstated in 2Q21) most investors are not aware that SPGI’s Operating Earnings suffer from significant flaws when compared to Core Earnings[3], a better measure of earnings because they exclude material unusual gains/losses missed by Wall Street. Harvard Business School and MIT Sloan prove the superiority of Core Earnings in The Journal of Financial Economics.
Figure 2: Core Earnings vs. SPGI Operating : March 2020 to Present (through 8/18/21[4])
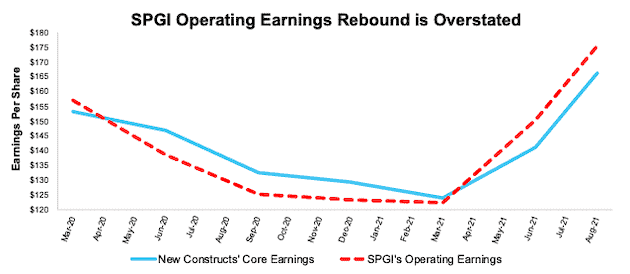
Sources: New Constructs, LLC, company filings, and S&P Global (SPGI). Note: the most recent period’s data for SPGI’s Operating Earnings is based on consensus estimates for companies with a non-standard fiscal year.
Our Core Earnings analysis is based on aggregated quarterly data for the S&P 500 constituents in each measurement period.
Five S&P 500 Companies with the Most Overstated Street Earnings
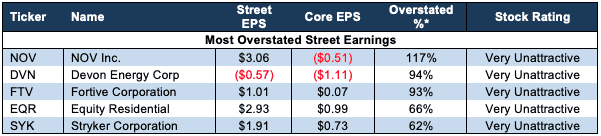
Figure 3 shows the S&P 500 stocks with a Very Unattractive Stock Rating and the most overstated Street Earnings (Street Distortion as a % of Street Earnings per share) over the TTM through 2Q21. Street Distortion equals the difference between Core Earnings per share and Street Earnings per share. Investors using Street Earnings miss the true profitability, or lack thereof, of these businesses.
Figure 3: S&P 500 Companies with Most Overstated Street Earnings: TTM as of 2Q21
Sources: New Constructs, LLC and company filings.
*Measured as Street Distortion as a percent of Street EPS
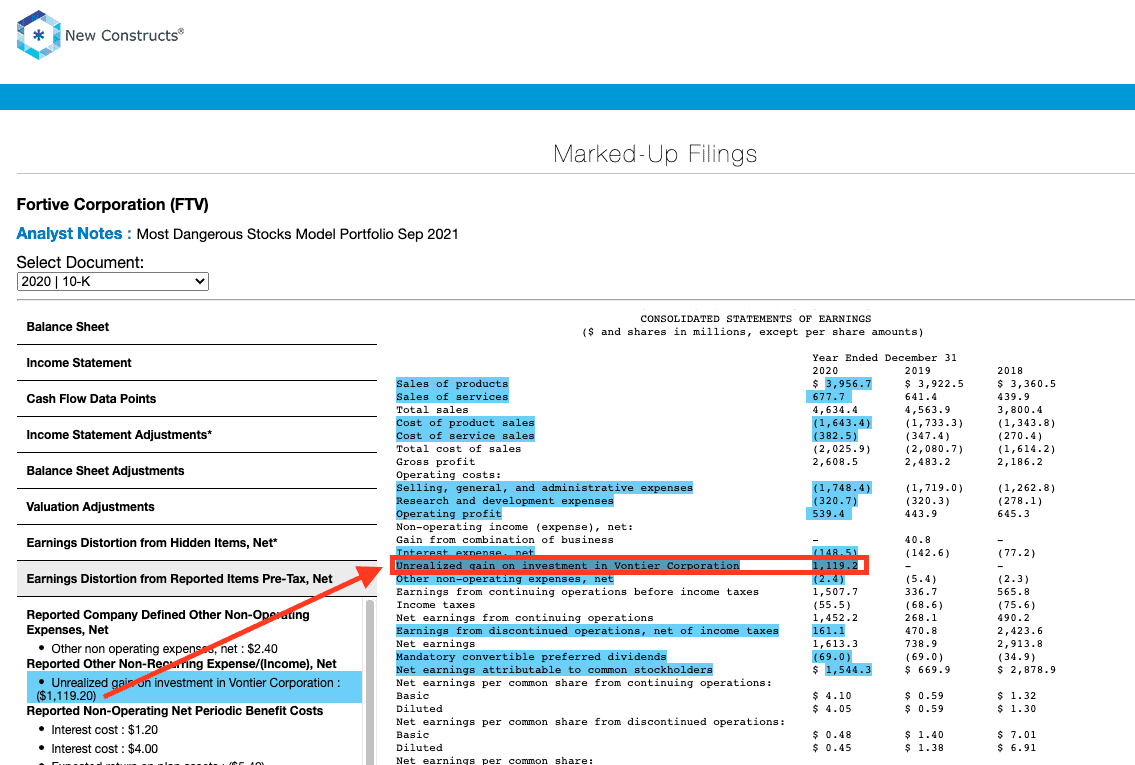
Next, for Fortive Corporation (FTV) one of the stock’s in the September’s Most Dangerous Stocks Model Portfolio, we detail the hidden and reported unusual items missed by GAAP Earnings, Operating Earnings and Street Earnings[5]. All of these unusual items are excluded by Core Earnings. Contact us for the same information on any of the stocks in our coverage universe.
Fortive Corporation’s TTM 2Q21 Street Earnings Overstated by $1.94/share
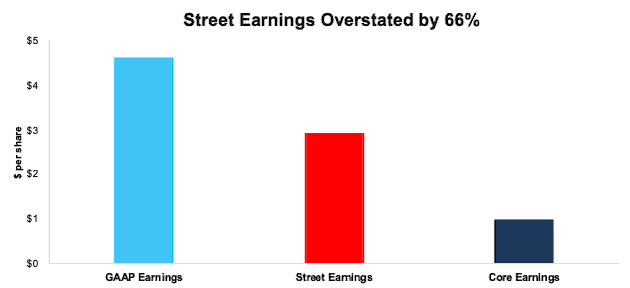
The Street Distortion, or difference between Fortive Corporation’s Street Earnings ($2.93/share) and Core Earnings ($0.99/share), is $1.94/share, per Figure 4. Fortive Corporation’s GAAP Earnings overstate Core Earnings by $4.62/share. Street Earnings do a better job of capturing unusual items for Fortive Corporation than GAAP, but they still miss 66% of the unusual items in Core Earnings
Figure 4: Comparing Fortive Corporation’s GAAP, Street, and Core Earnings: TTM as of 2Q21
Sources: New Constructs, LLC and company filings.
Below, we detail the differences between Core Earnings and GAAP Earnings so readers can audit our research. We cannot reconcile Core Earnings to Street Earnings because we do not have the details as to exactly what makes Street Earnings differ from GAAP Earnings.
Figure 5: Fortive Corporation’s GAAP Earnings to Core Earnings Reconciliation

Sources: New Constructs, LLC and company filings.
Hidden Unusual Gains, Net = -$74 million or -$0.21/per share
- -$54 million in non-operating expenses hidden in operating earnings in the TTM period, based on
- -$85 million impairment in 2020, of which $42 million included in TTM
- -$19 million restructuring charge in selling, general, and administrative expenses in 2020, of which $10 million included in TTM
- -$8 million restructuring charge in cost of sales in 2020, of which $4 million included in TTM
- $5 million gain on sale of property in 2020, of which $2 million included in TTM
- -$21 million in stand-up and separation-related costs in 3Q20
- $0.3 million in amortization of prior service costs in the TTM period, based on
- $0.3 million in 2020, of which $0.1 million included in TTM
- $0.1 million in 1Q21
- $0.1 million in 2Q21
Reported Unusual Expenses, Pre-Tax, Net = $1.2 billion or $3.26/per share
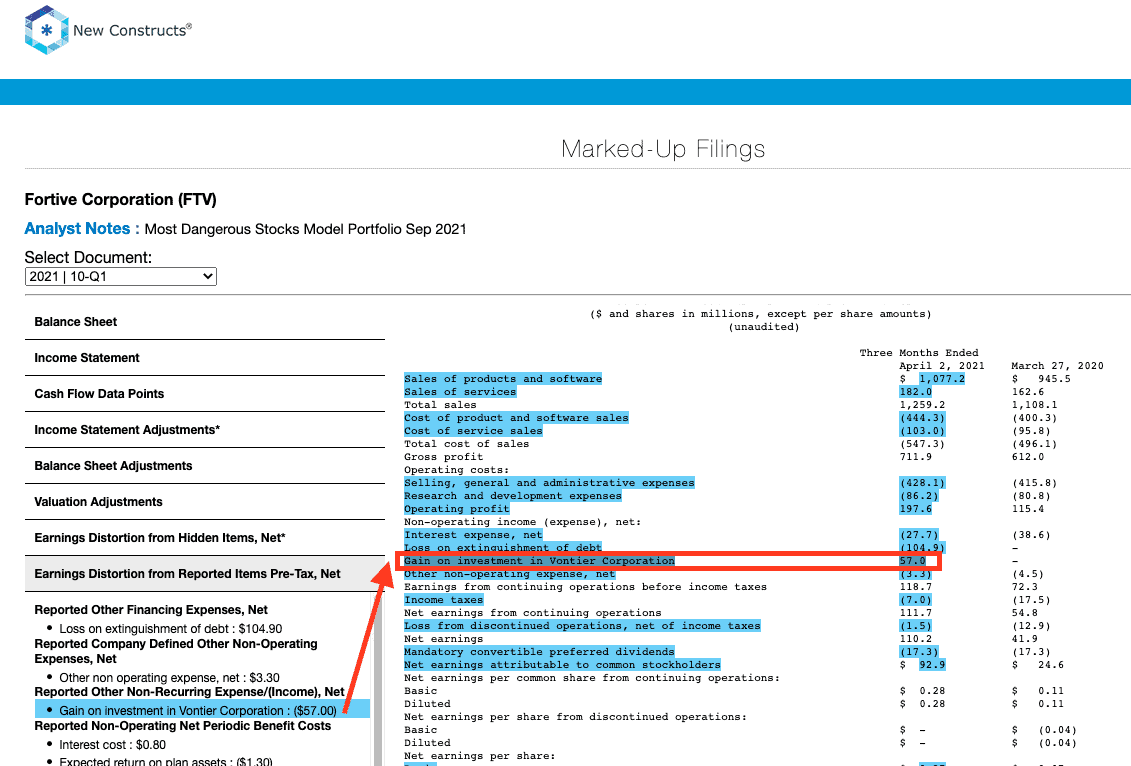
- $1.2 billion gain on investment in Vontier Corporation in the TTM period, based on
- $1.1 billion in 2020
- $57 million in 1Q21
- -$105 million loss on extinguishment of debt in 1Q21
- -$85 million goodwill charge in 2020
- $26 million gain on litigation dismissal in 2Q21
- -$11 million in “other non-operating expense” in the TTM period, based on
- -$1 million in 3Q20
- -$2 million in 4Q20
- -$3 million in 1Q21
- -$5 million in 2Q21
- -$3 million contra adjustment for recurring pension costs. These recurring expenses are reported in non-recurring line items, so we add them back and exclude them from Earnings Distortion.
Reported Unusual Expenses, After-Tax, Net = $159 million or $0.44/per share
- $159 million in earnings from discontinued operations in the TTM period, based on
- $161 million gain in 2020
- -$2 million loss in 1Q21
- -$1 million loss in 2Q21
Tax Distortion = $47 million or $0.13/per share
- We remove the tax impact of unusual items on reported taxes when we calculate Core Earnings. It is important that taxes get adjusted so they are appropriate for adjusted pre-tax earnings.
Our research shows Fortive Corporation’s Street Earnings and GAAP earnings fail to capture a very material amount of unusual items reported directly on the income statement.
Conclusion: Generate Alpha with More Reliable Core Earnings
As demonstrated above, Core Earnings do a better job of excluding unusual gains and losses and provide a more reliable earnings measure. All Core Earnings adjustments to GAAP Earnings are 100% transparent; so users can audit and trust the research.
Core Earnings: New Data & Evidence, a paper in The Journal of Financial Economics, unequivocally proves that the market misses the impact of our unrivaled analysis of footnotes as captured in our Core Earnings.
To enable you to easily monetize our novel factor, Earnings Distortion, or the difference between reported earnings and Core Earnings, we present multiple trading strategies that drive alpha. Learn more below.
- ExtractAlpha presents a long/short market-neutral strategy that generates 9.3% annualized return net of Fama-French 5 factors, momentum, short-term reversal, and 12 sectors. More details here.
- CloudQuant presents two strategies to monetize the alpha in Earnings Distortion:
- the long-only portfolio outperformed the S&P 500 by an average of 4% per annum over 10 years
- the dollar-neutral long-short portfolio returned 60% over 10 years with a Sharpe Ratio of ~1 over the last five years. More details here.
- AltHub presents three strategies to monetize the alpha in Earnings Distortion:
- Earnings Distortion S&P 500 Smart Beta Portfolio: 10-yr annualized return of 13.9% vs 12.1% for the S&P 500 with a Sharpe Ratio of 0.97.
- Earnings Distortion ML Model S&P 500 Smart Beta Portfolio: 3-yr annualized return of 18.2% vs 13.7% for the S&P 500 with a Sharpe Ratio of 0.82.
- Truth Stocks (Companies without Earnings Distortion) Portfolios:
- S&P 500 Universe: 10-yr annualized return of 16.8% vs 12.8% for the S&P 500 with a Sharpe Ratio of 0.7.
- Russell 3000 Universe: 9.5-yr annualized return of 28.4% vs 12.6% for the S&P 500 with a Sharpe Ratio of 1.
- More details here.
Check out this week’s Danger Zone interview with Chuck Jaffe of Money Life.
This article originally published on September 20, 2021.
Disclosure: David Trainer, Kyle Guske II, Alex Sword, and Matt Shuler receive no compensation to write about any specific stock, style, or theme.
Follow us on Twitter, Facebook, LinkedIn, and StockTwits for real-time alerts on all our research.
[1] The most recent Core Earnings and Street Earnings values are based on the latest audited financial data from calendar 2Q21 10-Qs.
[2] Average understated % is calculated as Street Distortion as a percent of Street Earnings. Street Distortion is the difference between Street Earnings and Core Earnings.
[3]As proven in Core Earnings: New Data & Evidence, a paper in The Journal of Financial Economics, only Core Earnings enable investors to overcome the flaws in legacy fundamental data and research.
[4] The earliest date that the 2Q21 10-Qs for all S&P 500 constituents were available.
[5] We cannot know precisely what is missed by other adjusted earnings measures because the details on how, precisely, they are calculated are not available.
[6] While we can explicitly reconcile Core Earnings to GAAP Earnings, we cannot do the same for Street Earnings because analysts do not publicly disclose what is captured in Street Earnings.
[7] For unusual items found only in the latest 10-K, we show the amount applied to our TTM calculation and link to the disclosure in the 10-K.