
While Zacks Analysts’ Earnings (referred to as Street Earnings in this report) overstate profits for the majority of S&P 500 companies, as shown in S&P 500 Companies That Overstated EPS by Over 75% in 3Q21, there are also many S&P 500 companies who’s Street Earnings understate their true profits. These companies are more profitable than investors realize and, in most cases, undervalued as well.
This report shows:
- The prevalence and magnitude of understated Street Earnings in the S&P 500
- Why Street Earnings (and GAAP earnings) are flawed
- Five S&P 500 companies with understated Street Earnings and a Very Attractive Stock Rating
- How Core Earnings[1] and our Earnings Distortion factor provide a new source of alpha
Over 130 S&P 500 Firms Have Understated Street Earnings
For 136 companies in the S&P 500, Street Earnings understated Core Earnings[2] for the trailing-twelve-months (TTM) ended calendar 3Q21. When Street Earnings understate Core Earnings, they do so by an average of -19% per company, per Figure 1. The understatement was more than 10% of Street Earnings for 8% of firms.
Figure 1: Street Earnings Understated by -19% on Average Through 3Q21[3]

Sources: New Constructs, LLC and company filings.
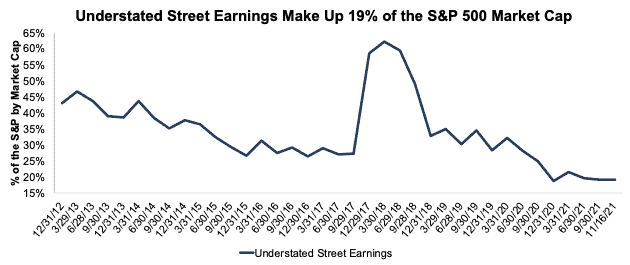
The 136 companies with understated Street Earnings make up 19% of the market cap of the S&P 500, which is the lowest percent since 2012 (earliest data available). See Figure 2.
Figure 2: Understated Street Earnings as % of Market Cap: 2012 through 11/16/21
Sources: New Constructs, LLC and company filings.
S&P Global’s Earnings Rebound Is Misleading
In theory, equity analysts create adjusted earnings measures like Street Earnings and Operating Earnings to exclude unusual gains and losses. In reality, these adjusted earnings measures rarely, if ever, fully capture unusual items that have a material impact on results.
Per Figure 3 (from our report Overstated Operating Earnings Increase Downside Risk for the S&P 500), the rebound in earnings is not as robust as SPGI’s Operating Earnings suggest. Year-over-year (YoY):
- SPGI’s Operating Earnings improved from $123.37/share to $189.88/share, or 54%
- Core Earnings improved from $129.35/share to $180.31/share, or 39%
SPGI’s Operating Earnings for the S&P 500 were 5% below Core Earnings in 3Q20 and were 5% higher in 3Q21. Unusual losses included in SPGI’s Operating Earnings drive the exaggerated declines while unusual gains lead to the exaggerated rebounds in SPGI’s Operating Earnings.
Figure 3: Core Earnings vs. SPGI Operating Earnings: 4Q19 – 3Q21[4]
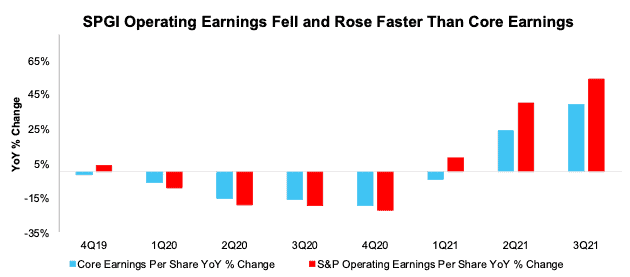
Sources: New Constructs, LLC, company filings, and S&P Global (SPGI). Note: the most recent period’s data for SPGI’s Operating Earnings is based on consensus estimates for companies with a non-standard fiscal year.
Our Core Earnings analysis is based on aggregated TTM data through 6/30/13 and aggregated quarterly data thereafter for the S&P 500 constituents in each measurement period.
The Five Most Understated Earnings in the S&P 500
Such widespread overstatement across the market means companies that are more profitable than investors may realize are fewer than in years past. However, they still exist if you know where to look.
Figure 4 shows the S&P 500 stocks with a Very Attractive Stock Rating and the most understated Street Earnings (Street Distortion as a % of Street Earnings per share) over the TTM through 3Q21. “Street Distortion” equals the difference between Core Earnings per share and Street Earnings per share. Investors using Street Earnings miss the true profitability of these businesses.
Figure 4: S&P 500 Companies with Most Understated Street Earnings: TTM as of 3Q21
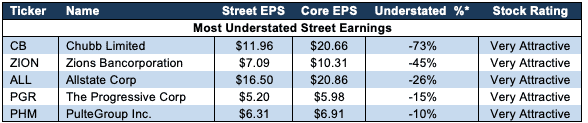
Sources: New Constructs, LLC and company filings.
*Measured as Street Distortion as a percent of Street EPS
In the section below, we detail the hidden and reported unusual items that distort GAAP Earnings for PulteGroup (PHM). All of these unusual items are removed from Core Earnings.
PulteGroup’s (PHM) TTM 3Q21 Street Earnings Understated by $0.60/share
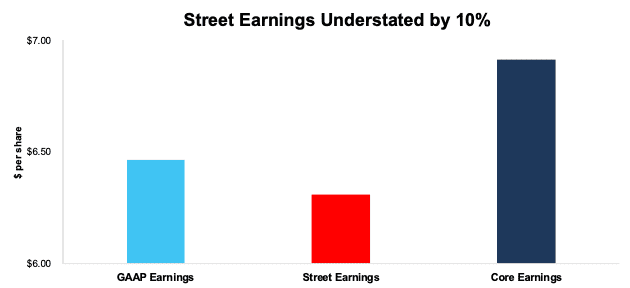
The difference between PulteGroup’s Street Earnings ($6.31/share) and Core Earnings ($6.91/share), is $0.60/share, per Figure 5. That difference is the Street Distortion, which is 10% of Street Earnings.
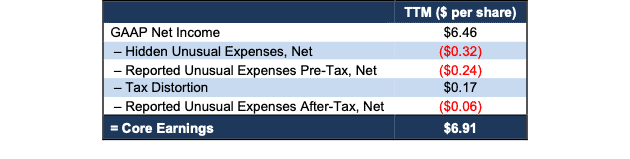
PulteGroup’s GAAP Earnings ($6.46/share) understate Core Earnings by $0.45/share. In other words, Street Earnings are more distorted by unusual items than GAAP Earnings for PulteGroup.
Figure 5: Comparing PulteGroup’s GAAP, Street, and Core Earnings: TTM as of 3Q21
Sources: New Constructs, LLC and company filings.
Below, we detail the differences between Core Earnings and GAAP Earnings so readers can audit our research. We would be happy to reconcile our Core Earnings with Street Earnings but cannot because we do not have the details on how analysts calculate their Street Earnings.
Figure 6 details the differences between PulteGroup’s Core Earnings and GAAP Earnings.
Figure 6: PulteGroup’s GAAP Earnings to Core Earnings Reconciliation: 3Q21
Sources: New Constructs, LLC and company filings.
More details:
Total Street Distortion of -$0.60/share is comprised of the following:
Hidden Unusual Expenses, Net = -$0.32/per share, which equals -$84.8 million and is comprised of
- -$160.1 million in interest expensed in the TTM period based on
- -$41.9 million in 3Q21
- -$39.4 million in 2Q21
- -$34.7 million in 1Q21
- -$44.1 million in 4Q20
- -$3 million in the TTM period based on -$10 million in severance expenses in the 2020 10-K
- -$2 million in the TTM period based on -$7 million in land impairments recorded in home sale cost of revenues in the 2020 10-K
- -$0.2 million in net realizable value adjustments bundled in land sale and other cost of revenues in the TTM period based on
- -$19 thousand in 2Q21
- -$0.2 million in 4Q20
- $80 million in gains based on adjustments to previously recorded reserves in the TTM period based on
- $1.3 million in 3Q21
- $49.1 million in 2Q21
- $6.1 million in 1Q21
- $23.4 million in 4Q20
Reported Unusual Expenses Pre-Tax, Net = -$0.24/per share, which equals -$64.4 million and is comprised of
- -$61.5 million loss on debt retirement in 1Q21
- -$10.9 million in losses on write-offs of deposits and other pre-acquisition costs in the TTM period based on
- -$3.6 million in 3Q21
- -$1.9 million in 2Q21
- -$1.4 million in 1Q21
- -$4.0 million in 4Q20
- $7.9 million in “miscellaneous” gains in the TTM period based on
- $1.5 million in 3Q21
- $1.7 million in 2Q21
- $2.4 million in 1Q21
- $2.3 million in 4Q20
Tax Distortion = $0.17/per share, which equals $45.3 million
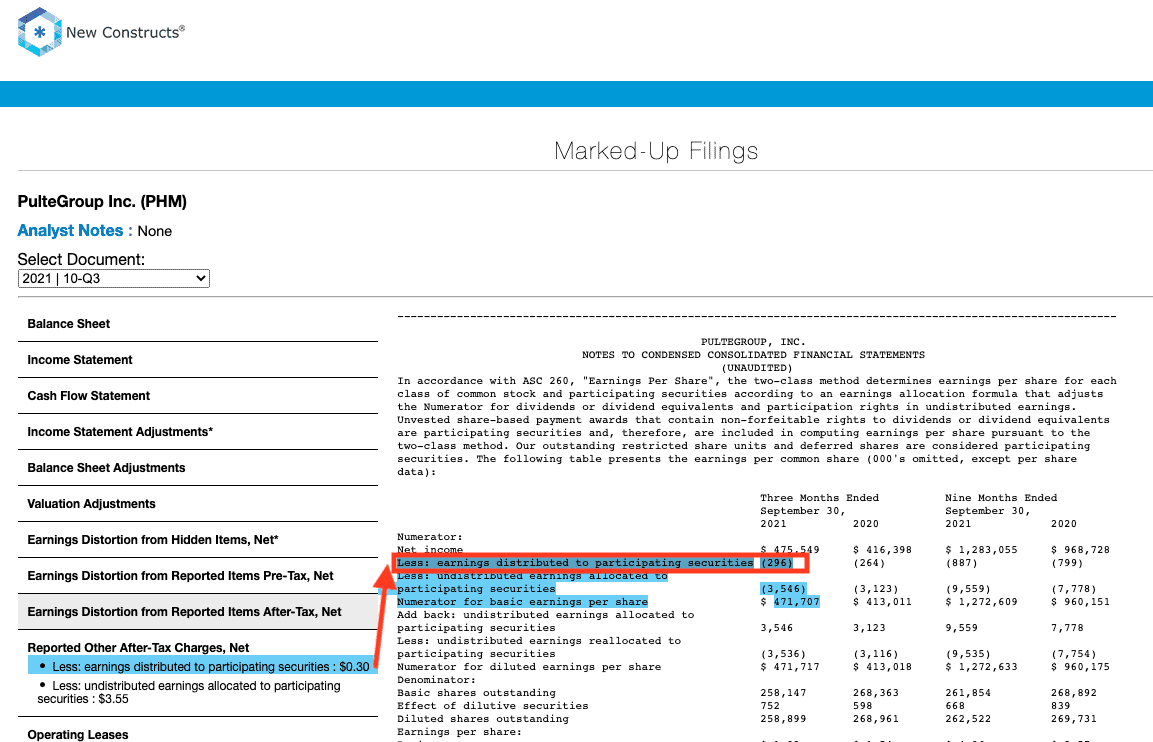
Reported Unusual Expenses After-Tax, Net = -$0.06/per share, which equals -$14.7 million and is comprised of
- -$13.5 million in undistributed earnings allocated to participating securities in the TTM period based on
- -$3.6 million in 3Q21
- -$3.7 million in 2Q21
- -$2.2 million in 1Q21
- -$4.1 million in 4Q20
- -$1.2 million in earnings distributed to participating securities in the TTM period based on
- -$0.3 million in 3Q21
- -$0.3 million in 2Q21
- -$0.3 million in 1Q21
- -$0.3 million in 4Q20
Given the similarities between Street Earnings for PulteGroup and GAAP Earnings, our research shows both Street and GAAP Earnings fail to capture a substantial amount of unusual expenses that make PulteGroup look less profitable than its Core Earnings indicate.
How to Make Money with Core Earnings & Earnings Distortion
As demonstrated above, Core Earnings do a better job of excluding unusual gains and losses and provide a more reliable earnings measure. All Core Earnings adjustments are 100% transparent; so users can audit and trust the research.
To enable you to easily monetize our new Earnings Distortion factor we present multiple trading strategies that drive alpha. Learn more below.
- ExtractAlpha presents a long/short market-neutral strategy that generates 9.3% annualized return net of Fama-French 5 factors, momentum, short-term reversal, and 12 sectors. More details here.
- CloudQuant presents two strategies to monetize the alpha in Earnings Distortion:
- the long-only portfolio outperformed the S&P 500 by an average of 4% per annum over 10 years
- the dollar-neutral long-short portfolio returned 60% over 10 years with a Sharpe Ratio of ~1 over the last five years. More details here.
- AltHub presents three strategies to monetize the alpha in Earnings Distortion:
- Earnings Distortion S&P 500 Smart Beta Portfolio: 10-yr annualized return of 13.9% vs 12.1% for the S&P 500 with a Sharpe Ratio of 0.97.
- Earnings Distortion ML Model S&P 500 Smart Beta Portfolio: 3-yr annualized return of 18.2% vs 13.7% for the S&P 500 with a Sharpe Ratio of 0.82.
- Truth Stocks (Companies without Earnings Distortion) Portfolios:
- S&P 500 Universe: 10-yr annualized return of 16.8% vs 12.8% for the S&P 500 with a Sharpe Ratio of 0.7.
- Russell 3000 Universe: 9.5-yr annualized return of 28.4% vs 12.6% for the S&P 500 with a Sharpe Ratio of 1.
- More details here.
This article originally published on December 10, 2021.
Disclosure: David Trainer, Kyle Guske II, and Matt Shuler receive no compensation to write about any specific stock, style, or theme.
Follow us on Twitter, Facebook, LinkedIn, and StockTwits for real-time alerts on all our research.
[1] Only Core Earnings enable investors to overcome the flaws in legacy fundamental data and research, as proven in Core Earnings: New Data & Evidence, written by professors at Harvard Business School (HBS) & MIT Sloan for The Journal of Financial Economics.
[2] Our Core Earnings research is based on the latest audited financial data, which is the calendar 3Q21 10-Q in most cases.
[3] Average understated % is calculated as Street Distortion, which is the difference between Street Earnings and Core Earnings.
[4] November 16, 2021, is the earliest date for which all the calendar 3Q2 10-Qs for the S&P 500 constituents were available.