
GAAP earnings remain highly overstated despite a year-over-year (YoY) rise in Core Earnings for all eleven sectors through the trailing-twelve-months (TTM) ended 1Q22, just as they did in 2021.
This report is an abridged and free version of S&P 500 & Sectors: Beware the GAAP Gap in S&P 500 Earnings, one of our quarterly series of reports on fundamental market and sector trends.
The full version of the report analyzes Core Earnings[1],[2] and GAAP earnings for the S&P 500 and each of its sectors (last quarter’s analysis is here). These reports are available to those with a Pro or higher membership or can be purchased below.
Generally Accepted Accounting Distortions
Figure 1 shows Core Earnings, which adjust for unusual gains/losses, are less volatile than GAAP earnings. For instance:
- In 2021, GAAP earnings rose 107% YoY compared to a 62% rise for Core Earnings.
- In 2020, GAAP earnings fell 30% YoY compared to an 18% fall for Core Earnings.
- In the TTM ended 1Q22, GAAP earnings rose 56% YoY compared to a 45% rise for Core Earnings.
Figure 1: S&P 500 Core Earnings Vs. GAAP Earnings YoY Percent Change: 1Q20 – 1Q22
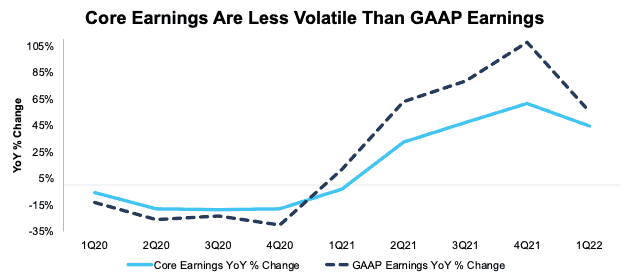
Sources: New Constructs, LLC and company filings.
Our Core Earnings analysis is based on aggregated TTM data for the sector constituents in each measurement period.
The May 16, 2022 measurement period incorporates the financial data from calendar 1Q22 10-Qs, as this is the earliest date for which all the calendar 1Q22 10-Qs for the S&P 500 constituents were available.
This report leverages our cutting-edge Robo-Analyst technology to deliver proven-superior[3] fundamental research and support more cost-effective fulfillment of the fiduciary duty of care.
1Q22 GAAP Earnings Widely Overstated[4]
45%, or 223 of the companies in the S&P 500, report GAAP Earnings that overstate Core Earnings for the TTM ended 1Q22. When GAAP Earnings overstate Core Earnings, they do so by an average of 22%, per Figure 2. The overstatement was greater than ten percent for 20% of companies. For comparison, in the TTM ended 1Q21 and calendar 2021, the percent of companies that overstate Core Earnings was 36% and 44% respectively.
Figure 2: S&P 500 GAAP Earnings Overstated by 22% On Average

Sources: New Constructs, LLC and company filings.
We use Funds from Operations (FFO) for Real Estate companies rather than GAAP Earnings.
The 223 companies with overstated GAAP earnings make up 55% of the market cap of the S&P 500.
Figure 3: Overstated Earnings as % of Market Cap: 2012 through 5/16/22
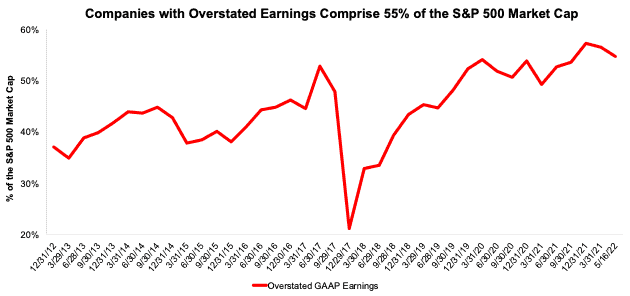
Sources: New Constructs, LLC and company filings.
Key Details on Select S&P 500 Sectors
All eleven sectors of the S&P 500 saw a year-over-year (YoY) rise in Core Earnings in the trailing-twelve-months (TTM) ended 1Q22, equal to the number of sectors with YoY improvement in 2021.
The Energy sector saw the largest YoY improvement, $116.3 billion, in Core Earnings, which rose from -$6.5 billion in 1Q21 to $109.8 billion in 1Q22.
The Technology sector generates the most Core Earnings of any sector and grew Core Earnings by 30% YoY in 1Q22. On the flip side, the Real Estate sector has the lowest Core Earnings, and the Consumer Non-cyclicals sector had the weakest YoY growth in 1Q22.
Below we highlight the Financials sector and a stock with some of the most Earnings Distortion (i.e. overstated GAAP earnings) in the sector.
Sample Sector Analysis[5]: Financials Sector
Figure 4 shows Core Earnings for the Financials sector, at $332.9 billion, rose 36% YoY in 1Q22, while GAAP earnings, at $397.5 billion, rose 18% over the same time.
Figure 4: Financials Core Earnings Vs. GAAP: 2004 – 1Q22
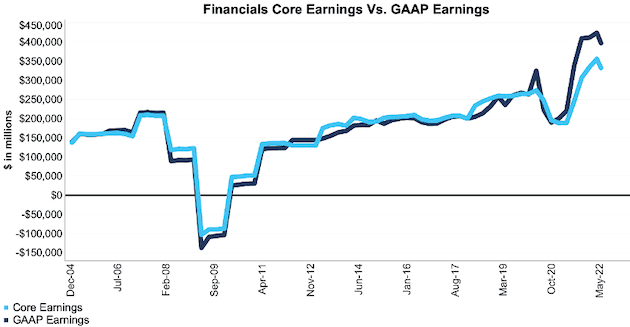
Sources: New Constructs, LLC and company filings.
Our Core Earnings analysis is based on aggregated TTM data for the sector constituents in each measurement period.
The May 16, 2022 measurement period incorporates the financial data from calendar 1Q22 10-Q, as this is the earliest date for which all the calendar 1Q22 10-Qs for the S&P 500 constituents were available.
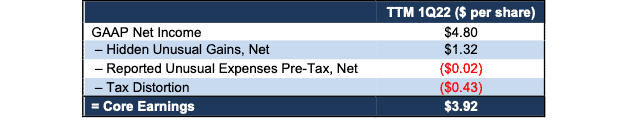
GAAP Earnings Overstatement Details: Wells Fargo & Company (WFC)
Below, we detail the hidden and reported unusual items that GAAP Earnings miss and we capture in Core Earnings for Wells Fargo & Company (WFC). After adjusting for unusual items, we find that Wells Fargo’s Core Earnings of $15.8 billion, or $3.92/share are much worse than reported GAAP Earnings of $19.3 billion, or $4.80/share.
Below, we detail the differences between Core Earnings and GAAP Earnings so readers can audit our research.
Figure 5: Wells Fargo’s GAAP Earnings to Core Earnings Reconciliation
Sources: New Constructs, LLC and company filings.
More details:
Total Earnings Distortion of $0.88/share, which equals $3.5 billion, is comprised of the following:
Hidden Unusual Gains, Net = $1.32/per share, which equals $5.3 billion and is comprised of
- $5.5 billion in net non-operating income hidden in operating earnings based on
- $690 million in 1Q22 in unrealized gains from observable price changes in the TTM
- $1.8 billion in 4Q21 in unrealized gains from observable price changes in the TTM
- $93 million in 4Q21 in reduction in other lease costs
- $74 million in 4Q21 in dispositions of premises and equipment
- $816 million in 3Q21 in unrealized gains from observable price changes in the TTM
- $2.0 billion in 2Q21 in unrealized gains from observable price changes in the TTM
- -$171 million in non-recurring pension expenses in the TTM period based on
- $3 million amortization of prior service credit in 1Q22
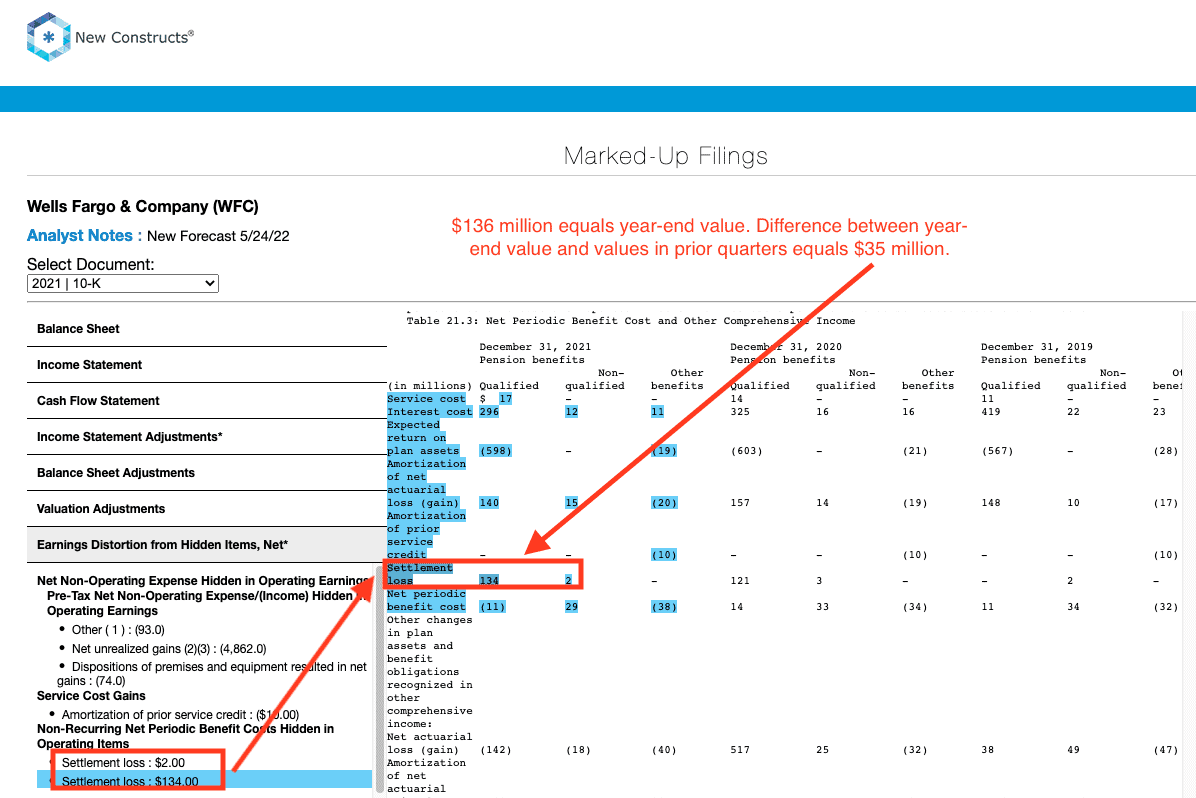
- -$48 million settlement loss in 1Q22
- $1 million amortization of prior service credit in 4Q21
- -$35 million settlement loss in 4Q21
- $2 million amortization of prior service credit in 3Q21
- -$35 million settlement loss in 3Q21
- $5 million amortization of prior service credit in 2Q21
- -$64 million settlement loss in 2Q21
Reported Unusual Expenses Pre-Tax, Net = $0.02/per share, which equals -$68 million and is comprised of
- -$68 million in restructuring charges in the TTM period based on
- -$5 million charge in 1Q22
- -$66 million charge in 4Q21
- -$1 million charge in 3Q21
- $4 million gain in 2Q21
Tax Distortion = -$0.43/per share, which equals -$1.7 billion
This article originally published on May 26, 2022.
Disclosure: David Trainer, Kyle Guske II, and Matt Shuler receive no compensation to write about any specific stock, style, or theme.
Follow us on Twitter, Facebook, LinkedIn, and StockTwits for real-time alerts on all our research.
[1] The Journal of Financial Economics features the superiority of our Core Earnings in Core Earnings: New Data & Evidence.
[2] Based on the latest audited financial data, which is the calendar 1Q22 10-Q in most cases. Price data as of 5/16/22.
[3] Our research utilizes our Core Earnings, a more reliable measure of profits, as proven in Core Earnings: New Data & Evidence, written by professors at Harvard Business School (HBS) & MIT Sloan and published in The Journal of Financial Economics.
[4] Overstated companies include all companies with Earnings Distortion >0.1% of GAAP earnings.
[5] The full version of this report provides analysis for all eleven sectors.