
Results for Core Earnings and GAAP earnings are very different this quarter and red flags about the quality of reported earnings while also raising the risk of earnings misses in coming quarters. In other words, 4Q23 earnings seasons could be ugly. These results underscore the more stable nature of Core Earnings. Because we remove unusual gains and losses, Core Earnings are not prone to the large swings seen in GAAP Earnings.
This report is an abridged and free version of S&P 500 & Sectors: GAAP vs Core Earnings Update for 3Q23, one of our quarterly series of reports on fundamental market and sector trends. The full reports are available to Professional and Institutional members.
The full version of the report analyzes Core Earnings[1],[2] and GAAP earnings for the S&P 500 and each of its sectors (last quarter’s analysis is here) from 2004 to present.
This report leverages our cutting-edge Robo-Analyst technology to deliver proven-superior[3] fundamental research and support more cost-effective fulfillment of the fiduciary duty of care.
GAAP Earnings Rise Is Again Misleading in 3Q23
Our superior fundamental data protects investors from being fooled by misleading trends in un-scrubbed GAAP Earnings. Looking beyond the headlines reveals that the recent changes in GAAP Earnings may be an illusion for three reasons:
- Unusual gains are artificially elevating GAAP Earnings and cannot persist forever.
- Core Earnings growing slower suggests GAAP Earnings have less room to rise before normalizing
- Understated GAAP earnings in prior quarters (kitchen sink effect) set up easy comps and may cause expectations for future earnings to be too high.
If the rise in GAAP Earnings proves to be an illusion, investors could be in for a tough 4Q23. See Figure 1 in the full report.
Generally Accepted Accounting Distortions
Figure 1 in the full report shows GAAP Earnings for the S&P 500 meaningfully differ from Core Earnings for the fifth consecutive quarter.
GAAP Earnings[4] Understate Core Earnings for Nearly Two-Thirds of the S&P 500 (by Market Cap)
62% of the companies in the S&P 500 reported GAAP Earnings that are lower than Core Earnings for the TTM ended 3Q23.
When GAAP Earnings understate Core Earnings, they do so by an average of 70%, per Figure 1.
Figure 1: S&P 500 GAAP Earnings Understated by 70% On Average

Sources: New Constructs, LLC and company filings.
We use Funds from Operations (FFO) for Real Estate companies rather than GAAP Earnings.
The 312[5] companies with understated GAAP Earnings make up 53% of the market cap of the S&P 500 as of November 14, 2023. Companies with understated GAAP earnings made up 53% of the S&P 500 market cap in 2Q23 and 56% of the S&P 500 market cap in 3Q22.
Figure 2: Understated Earnings as % of Market Cap: 2012 through 11/14/23
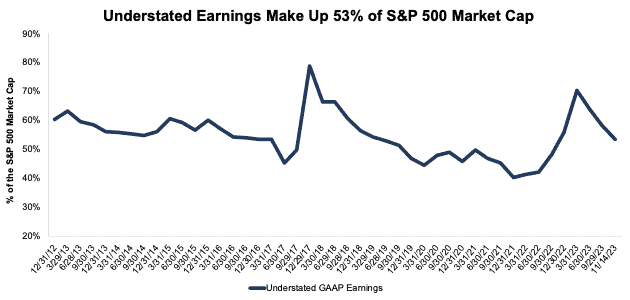
Sources: New Constructs, LLC and company filings.
Key Details on Select S&P 500 Sectors
Six of eleven sectors saw a QoQ rise in Core Earnings through the TTM ended 3Q23.
The Consumer Cyclicals sector saw the largest QoQ improvement in Core Earnings.
The Technology sector generates the most Core Earnings. On the flip side, the Real Estate sector has the lowest Core Earnings.
Below we highlight the Industrials sector and a stock with some of the most negative Earnings Distortion (i.e. understated GAAP earnings) in the sector.
Sample Sector Analysis[6]: Industrials Sector
Figure 3 shows Core Earnings for the Industrials sector, at $163.6 billion, rose 4% QoQ in 3Q23, while GAAP earnings, at $160.7 billion, fell <1% over the same time.
Figure 3: Industrials Core Earnings Vs. GAAP: 2004 – 3Q23
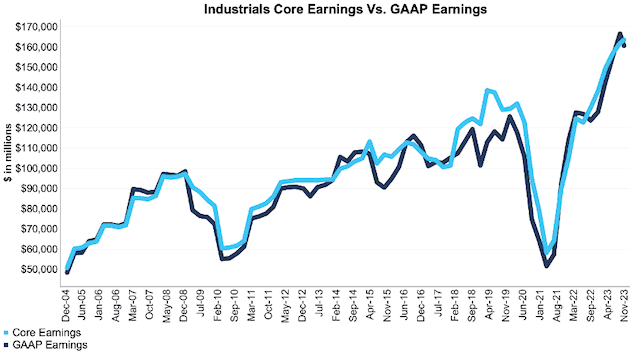
Sources: New Constructs, LLC and company filings.
Our Core Earnings analysis is based on aggregated TTM data for the sector constituents in each measurement period.
The November 14, 2023 measurement period incorporates the financial data from calendar 3Q23 10-Qs, as this is the earliest date for which all the calendar 3Q23 10-Qs for the S&P 500 constituents were available.
GAAP Earnings Understatement Details: Caterpillar (CAT)
Below, we detail the hidden and reported unusual items overlooked in GAAP Earnings and captured in Core Earnings for Caterpillar (CAT). After adjusting for unusual items, we find that Caterpillar’s Core Earnings of $10.5 billion, or $20.27/share are much higher than reported GAAP Earnings of $9.1 billion, or $17.62/share.
Caterpillar’s Stock Rating is Attractive, in part due to its rising economic earnings, high free cash flow yield, and low price-to-economic book value (PEBV) ratio of 1.0.
Below, we detail the differences between Core Earnings and GAAP Earnings so readers can audit our research.
Figure 4: Caterpillar’s GAAP Earnings to Core Earnings Reconciliation: TTM through 3Q23
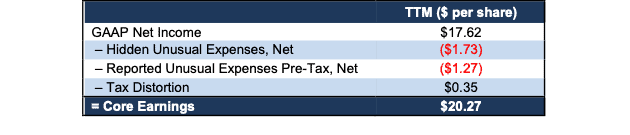
Sources: New Constructs, LLC and company filings.
More details:
Total Earnings Distortion of -$2.65/share, which equals -$1.4 billion, is comprised of the following:
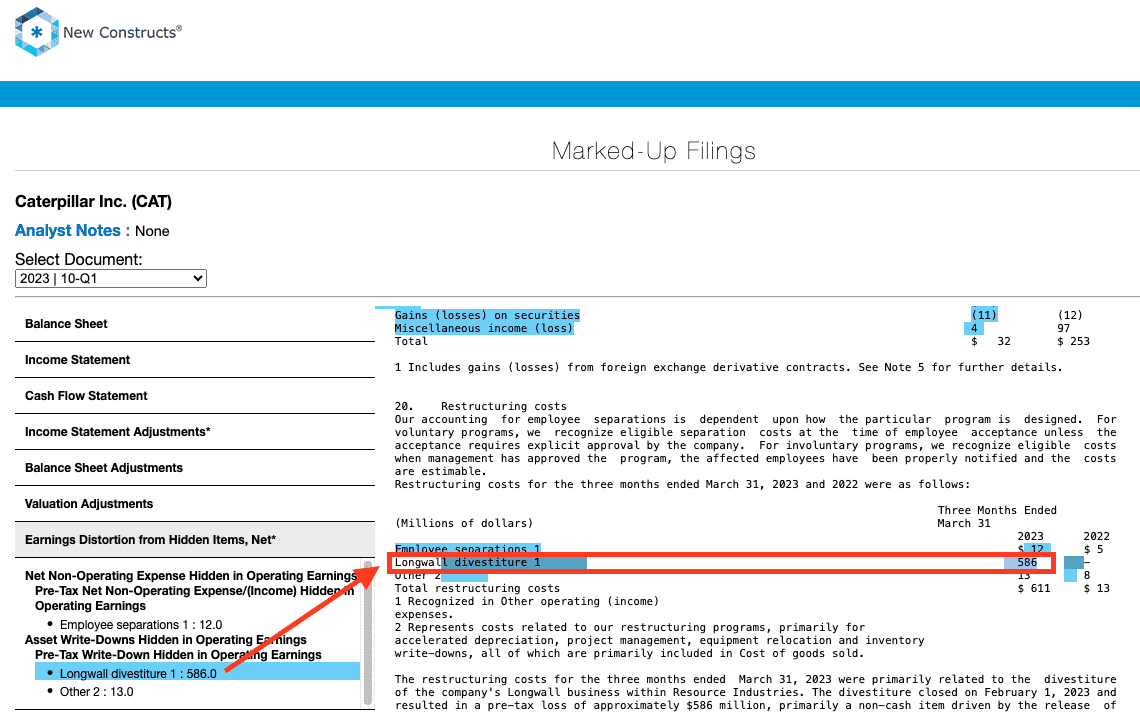
Hidden Unusual Expenses Pre-Tax, Net = -$1.73/per share, which equals -$892 million and is comprised of:
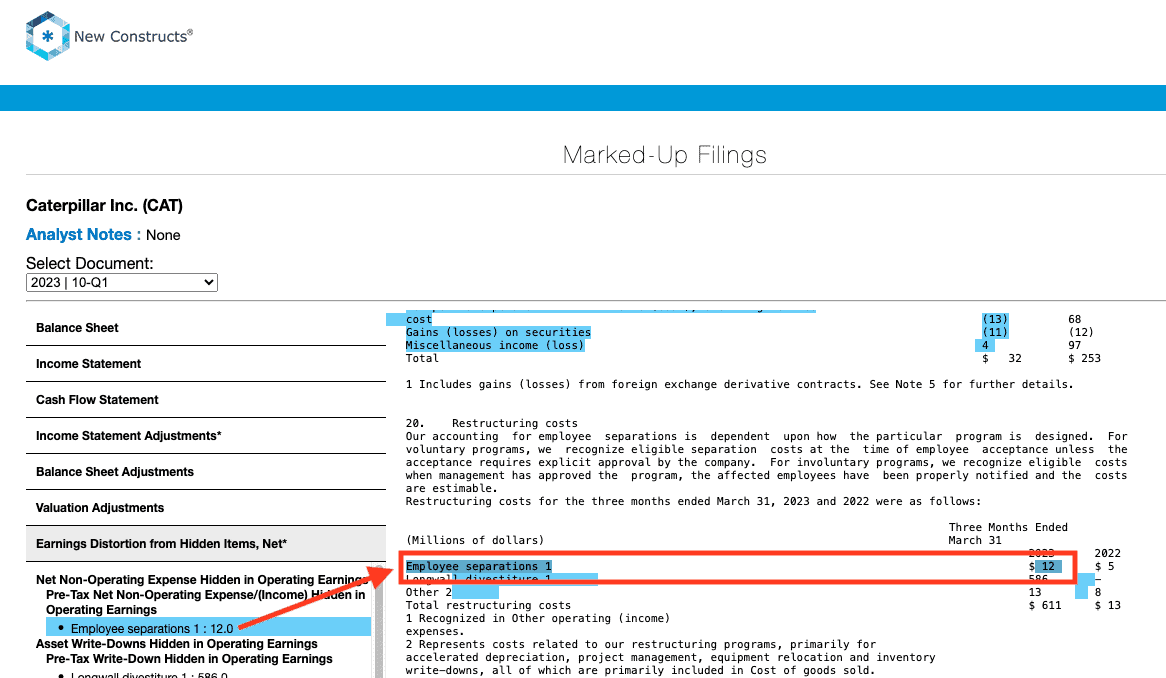
- -$586 million in Longwall divestiture restructuring costs – Page 39 1Q23 10-Q
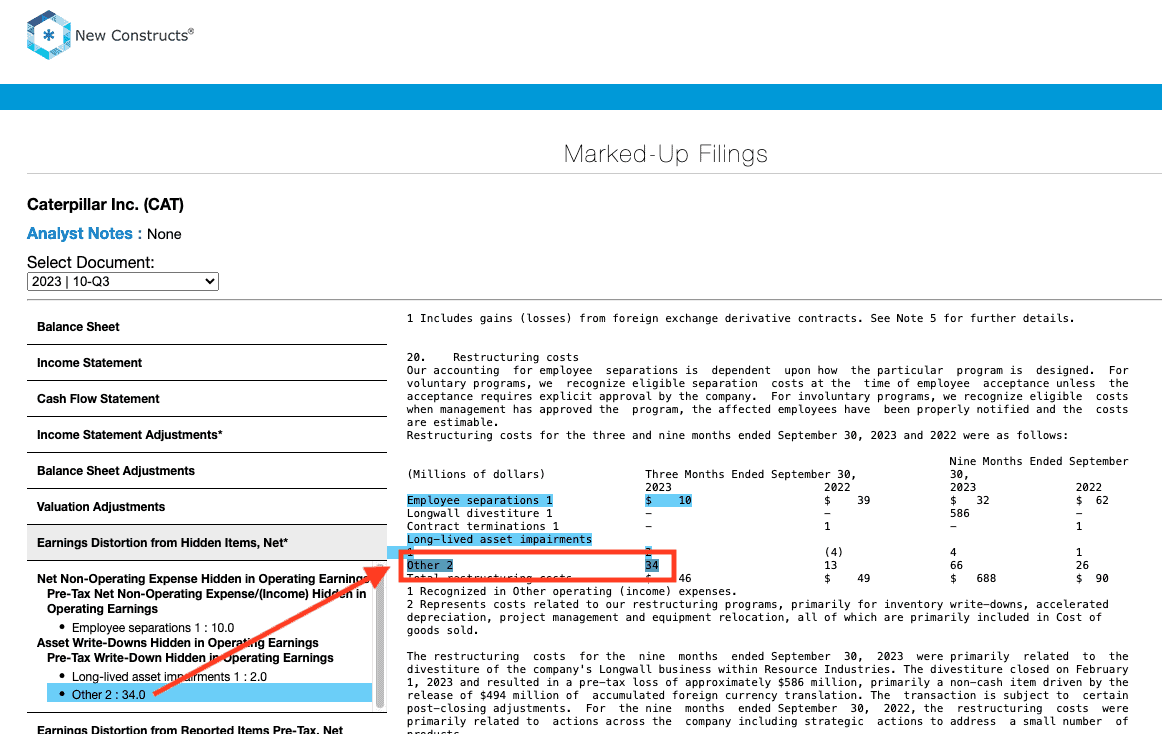
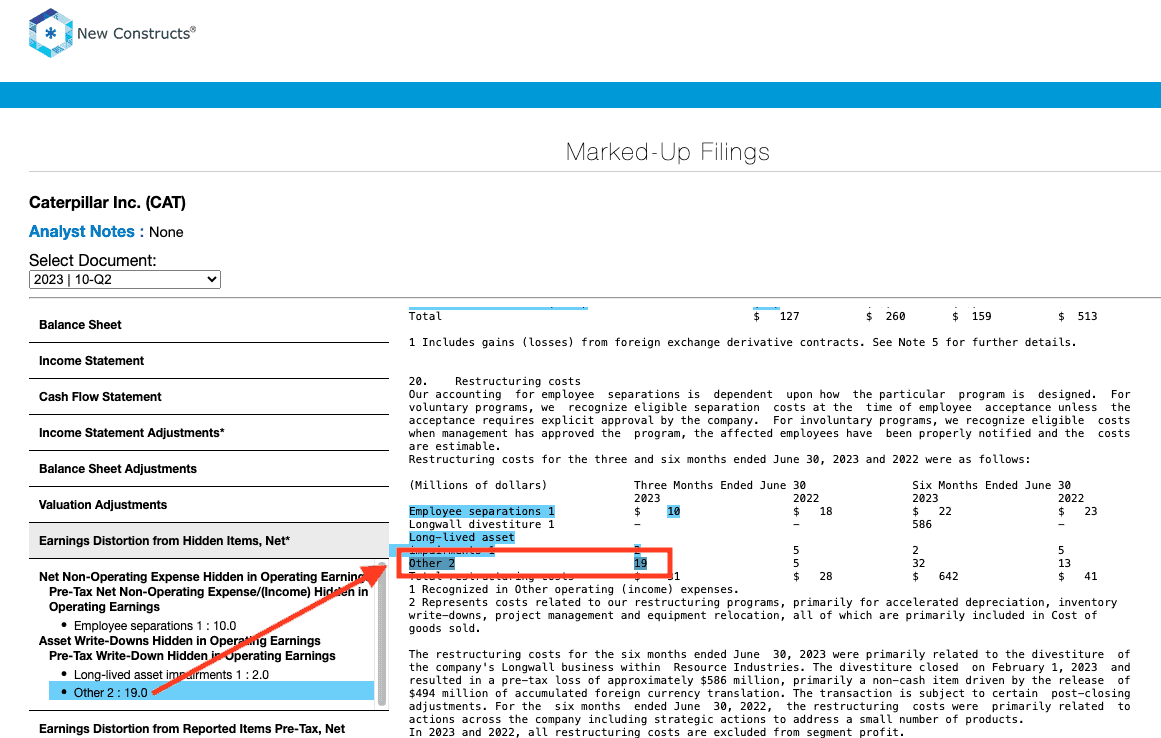
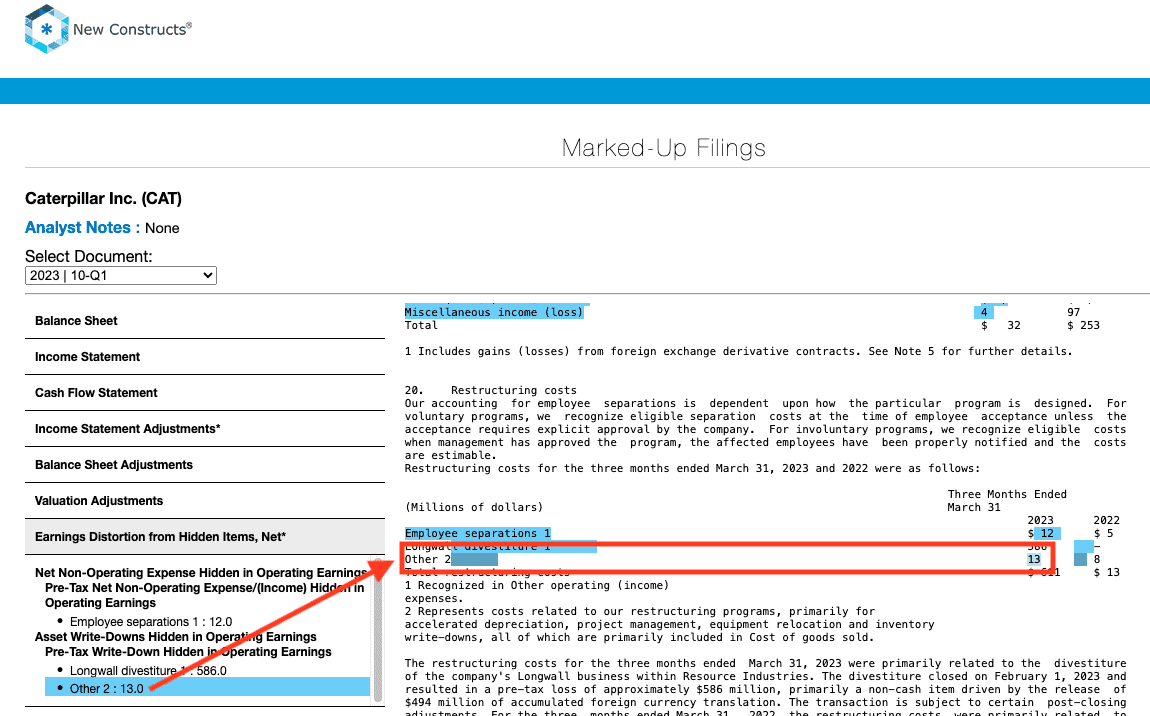
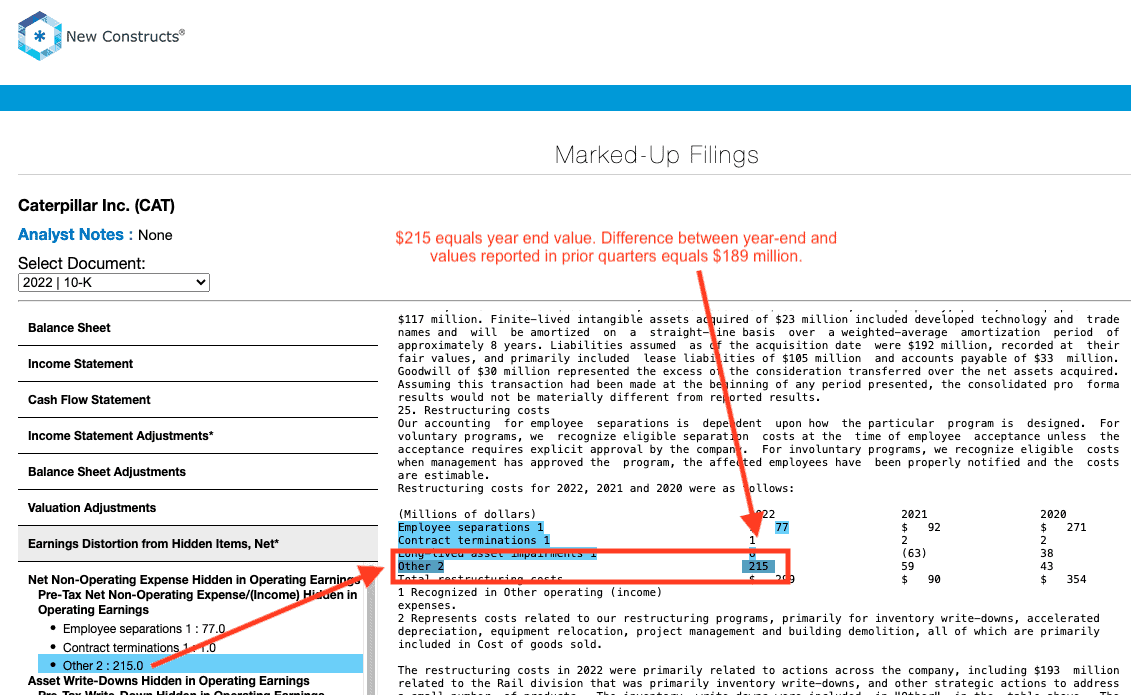
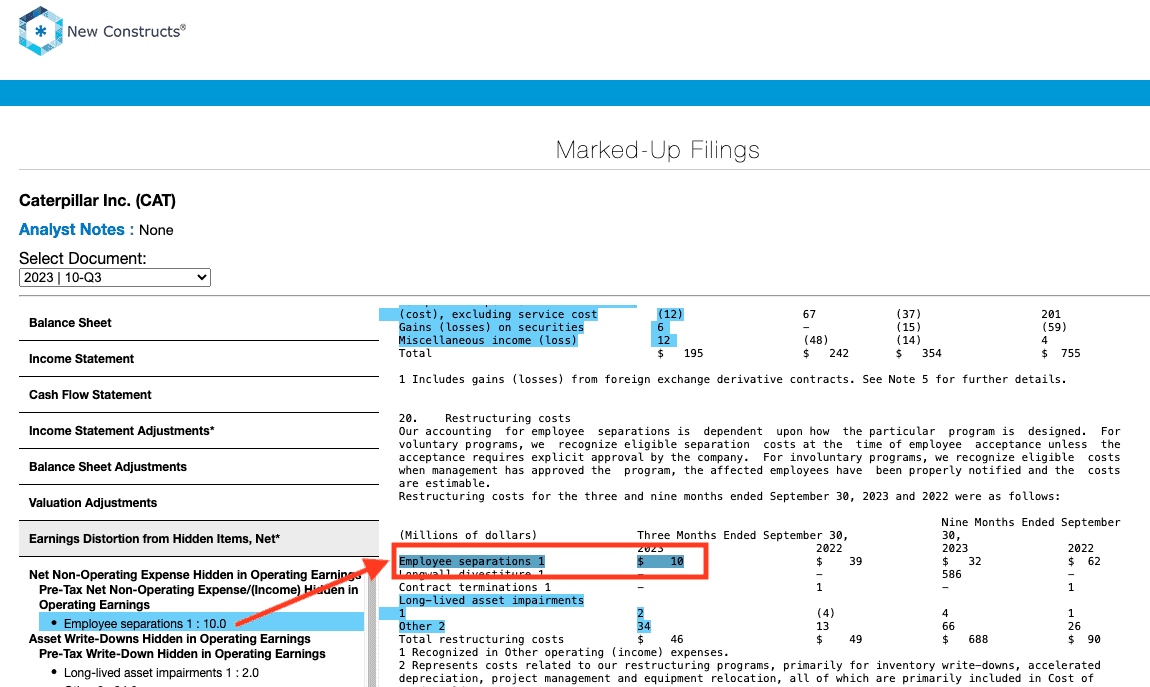
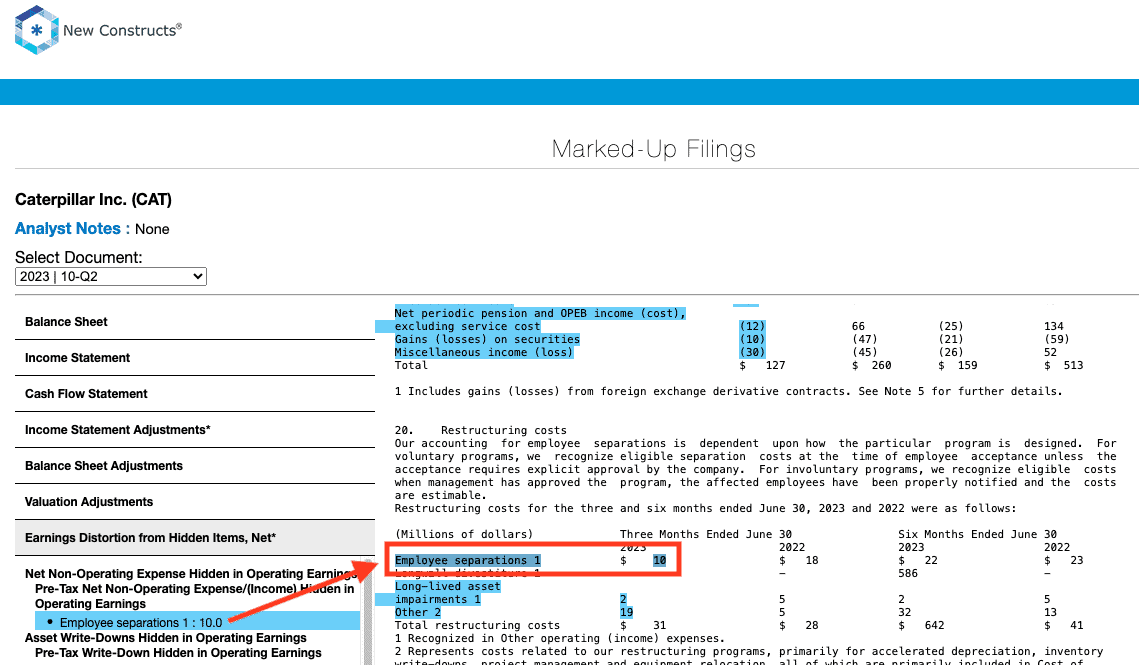
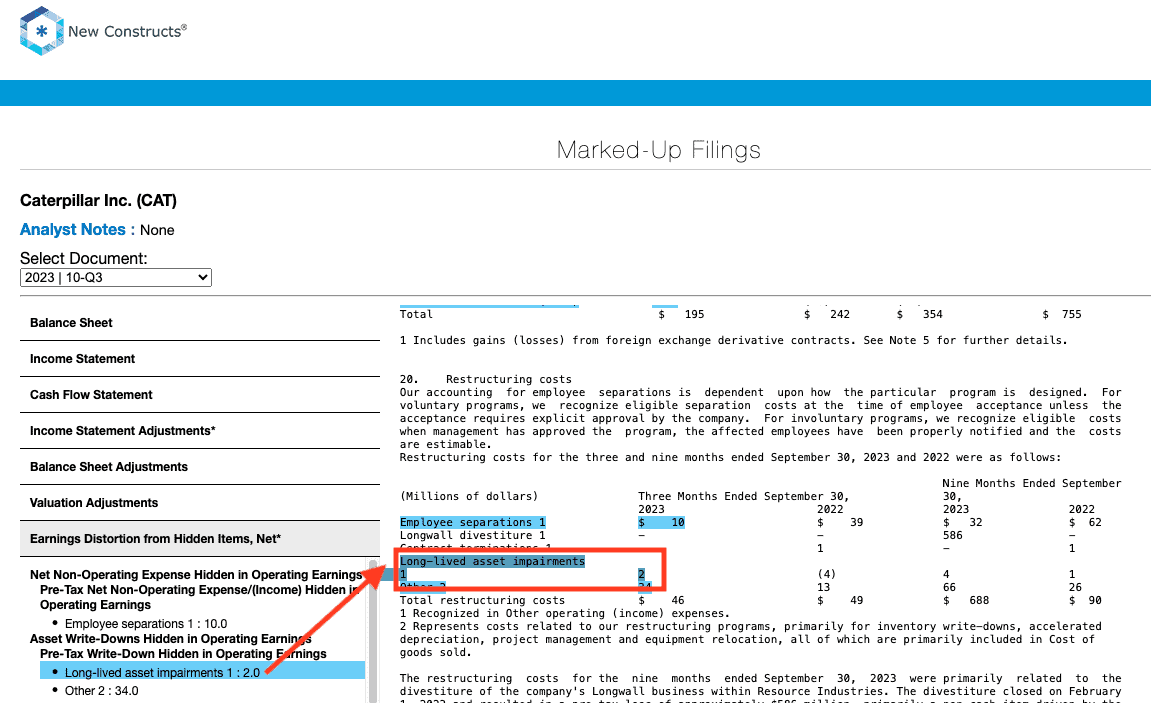
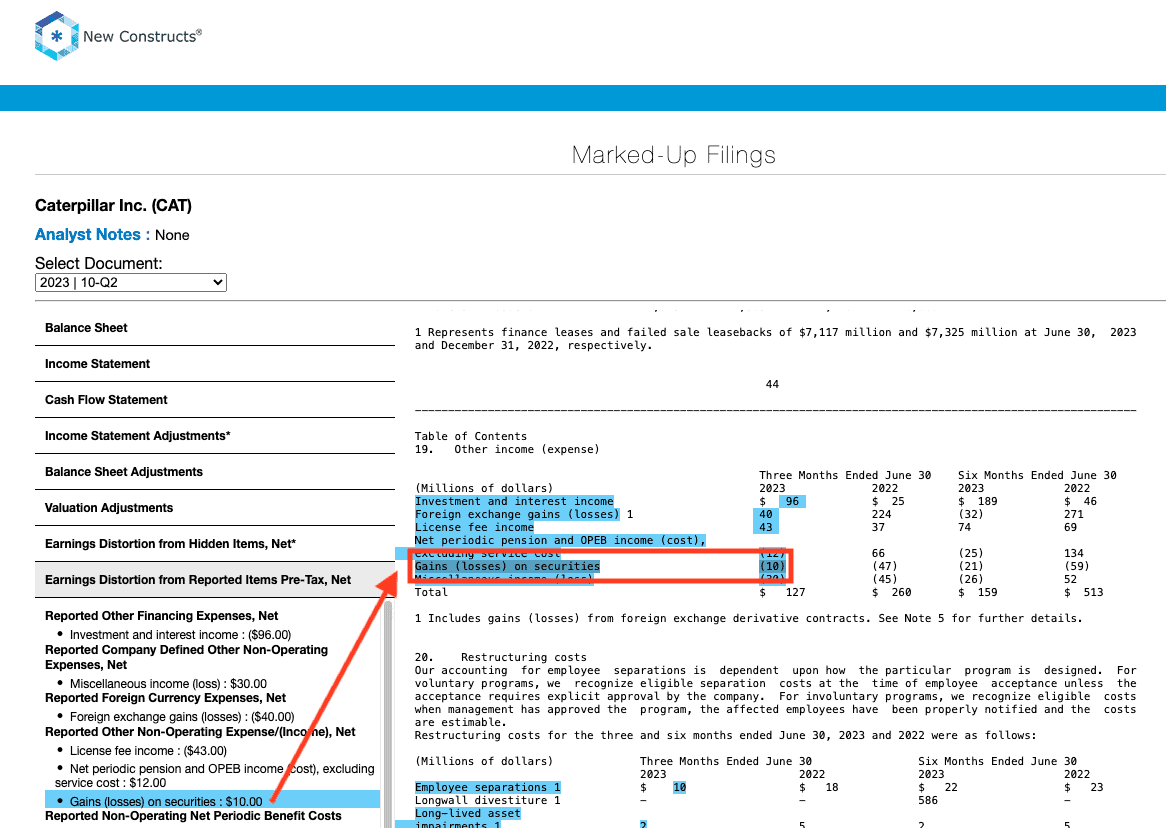
- -$255 million in Other restructuring costs in the TTM period based on
- -$34 million in 3Q23
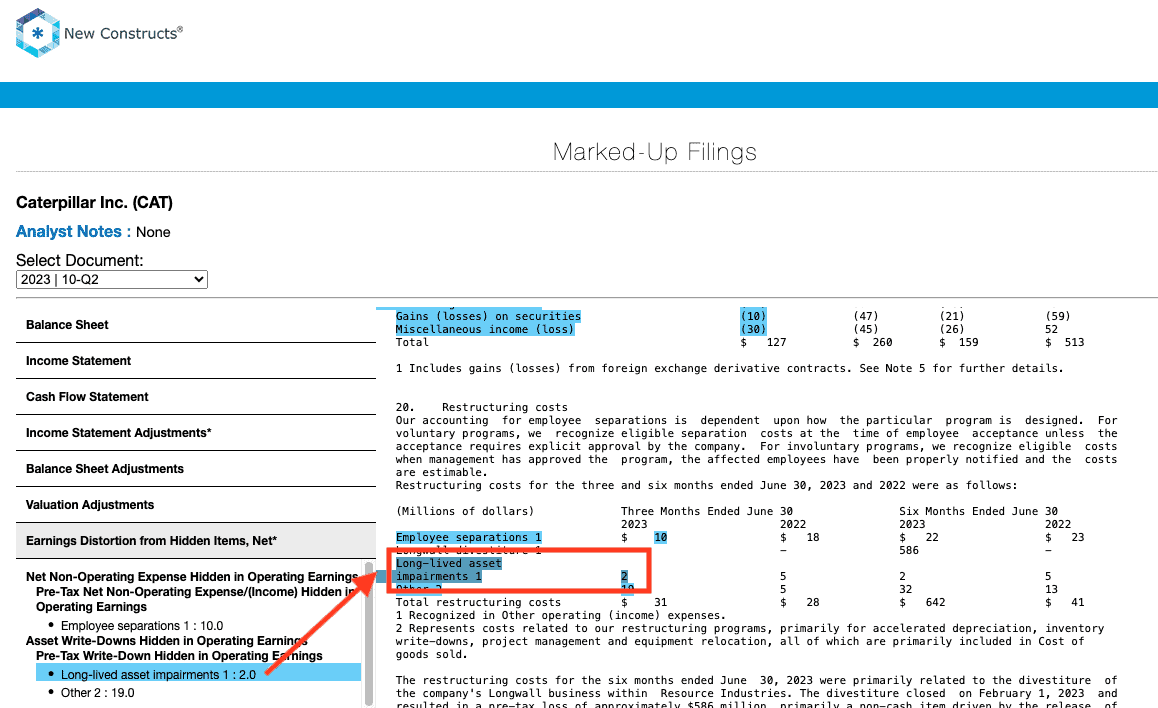
- -$19 million in 2Q23
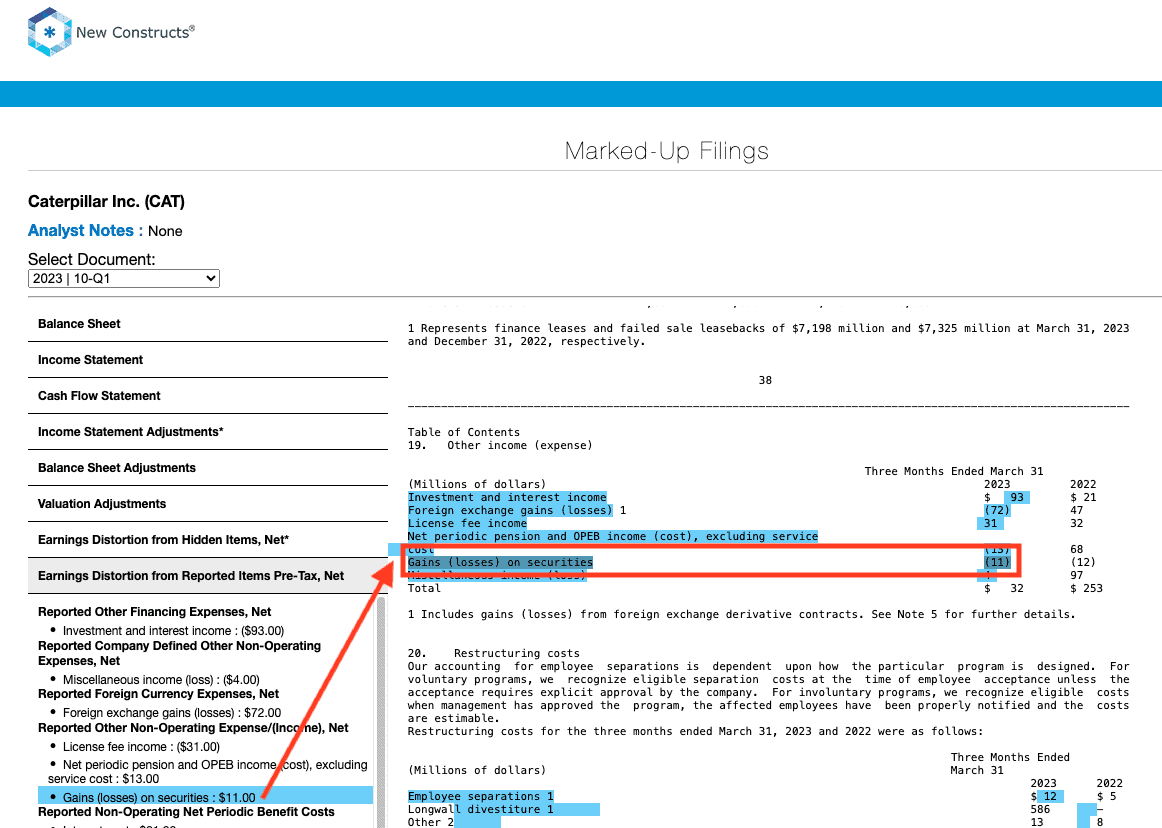
- -$13 million in 1Q23
- -$189 million in 4Q23
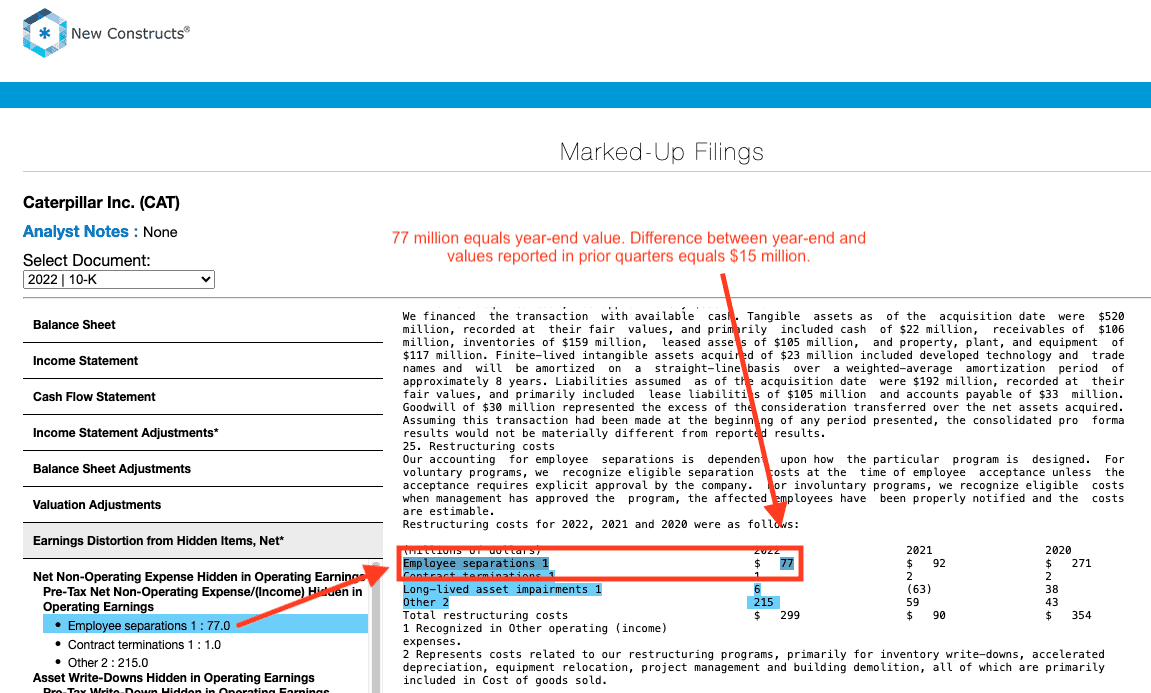
- -$47 million in employee separation restructuring costs in the TTM period based on
- -$10 million in 3Q23
- -$10 million in 2Q23
- -$12 million in 1Q23
- -$15 million in 4Q23
- -$4 million in long-lived asset impairment restructuring costs in the TTM period based on
- -$2 million in 3Q23
- -$2 million in 2Q23
Reported Unusual Expenses Pre-Tax, Net = -$1.27/per share, which equals -$659 million and is comprised of:
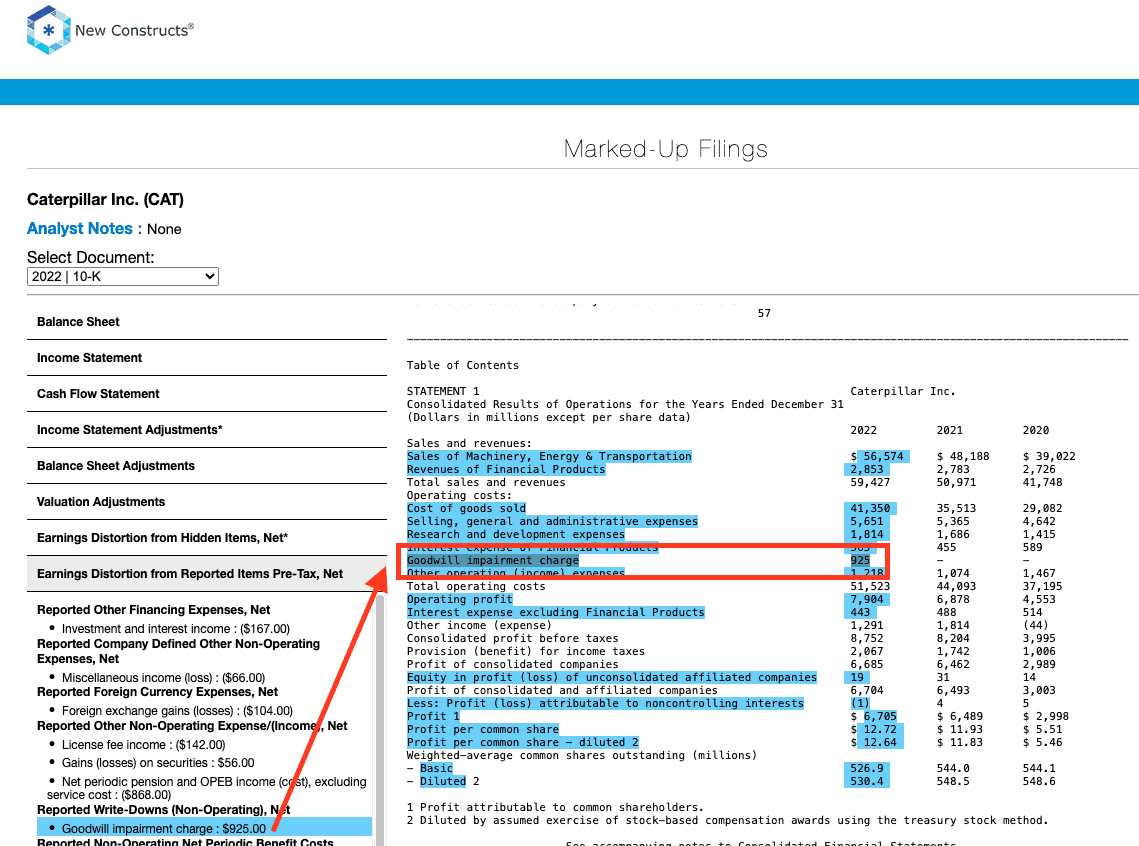
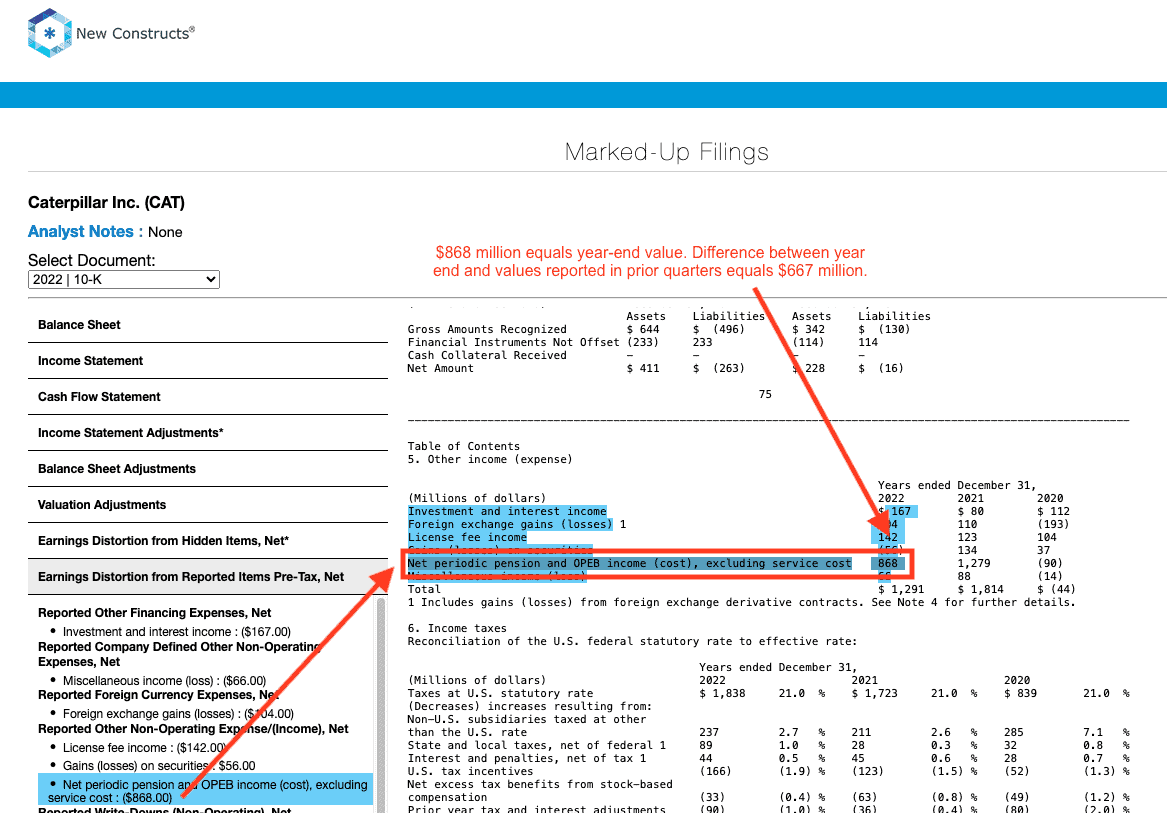
- -$925 million goodwill impairment charge in the TTM based on -$925 million charge reported in 2022 10-K
- -$624 million contra adjustment for recurring pension costs. These recurring expenses are reported in non-recurring line items, so we add them back and exclude them from Earnings Distortion.
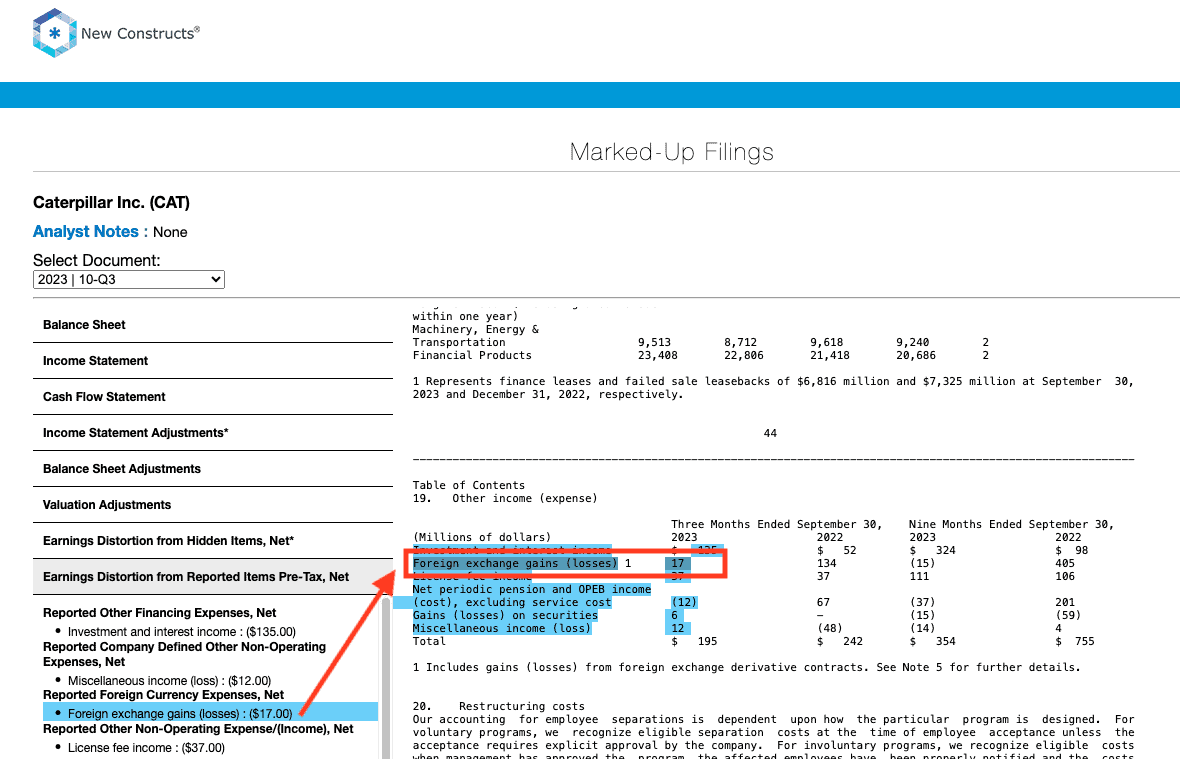
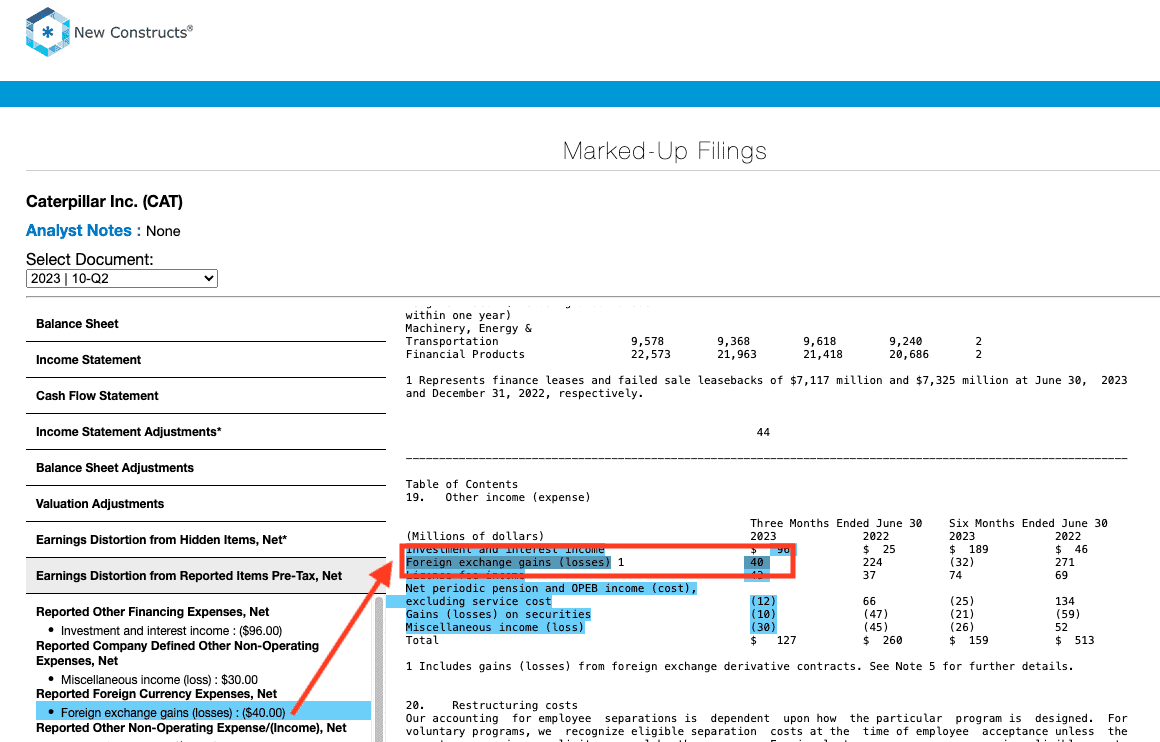
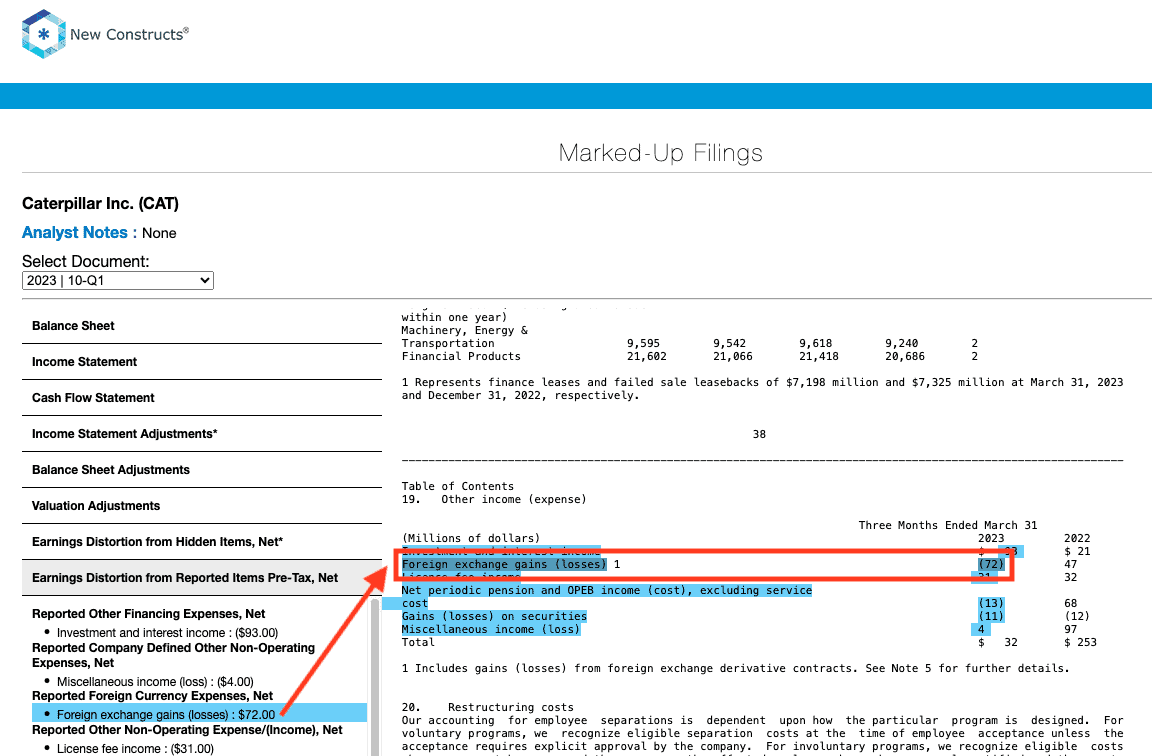
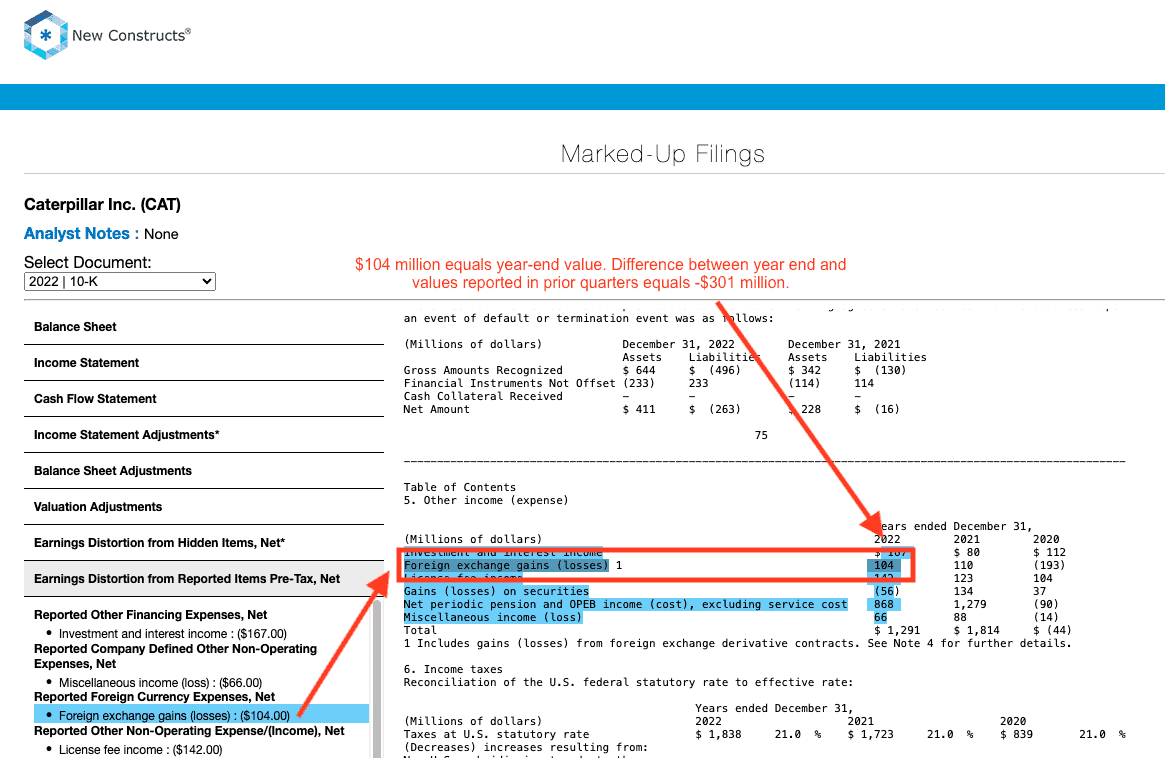
- -$316 million in foreign exchange losses in the TTM period based on
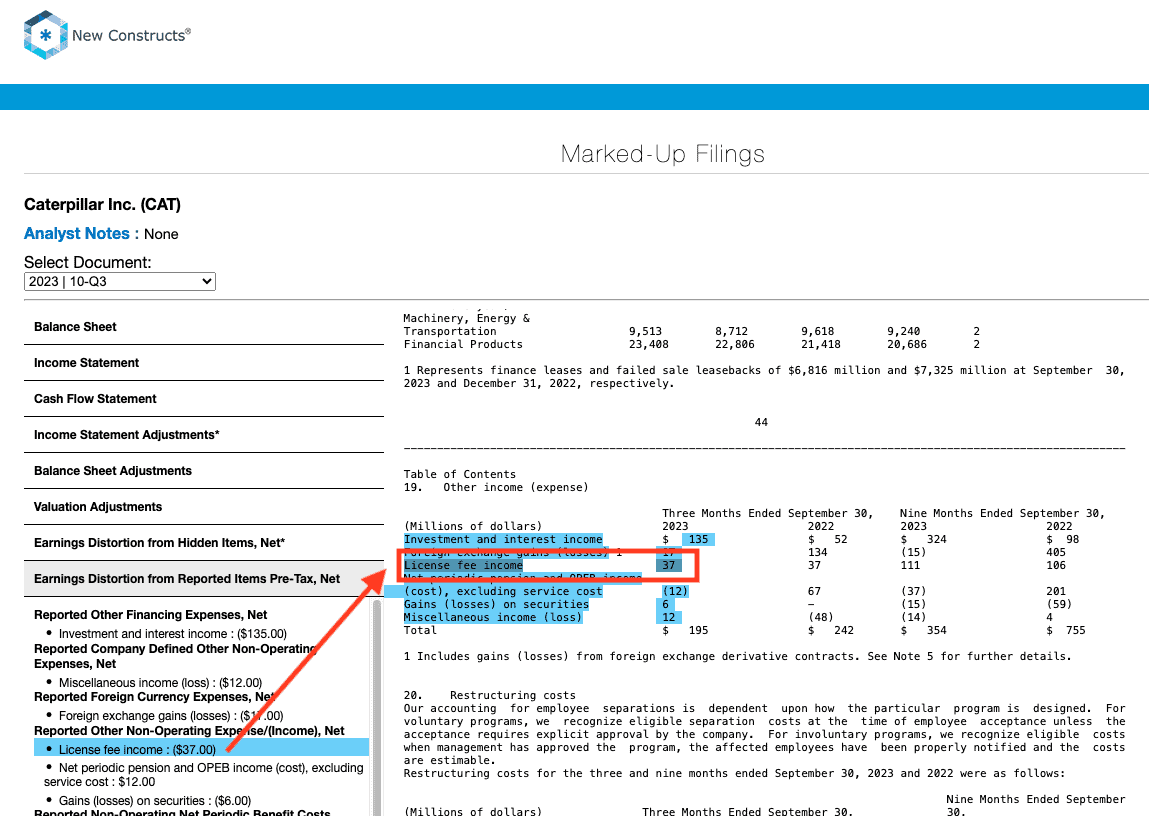
- $17 million gain in 3Q23
- $40 million gain in 2Q23
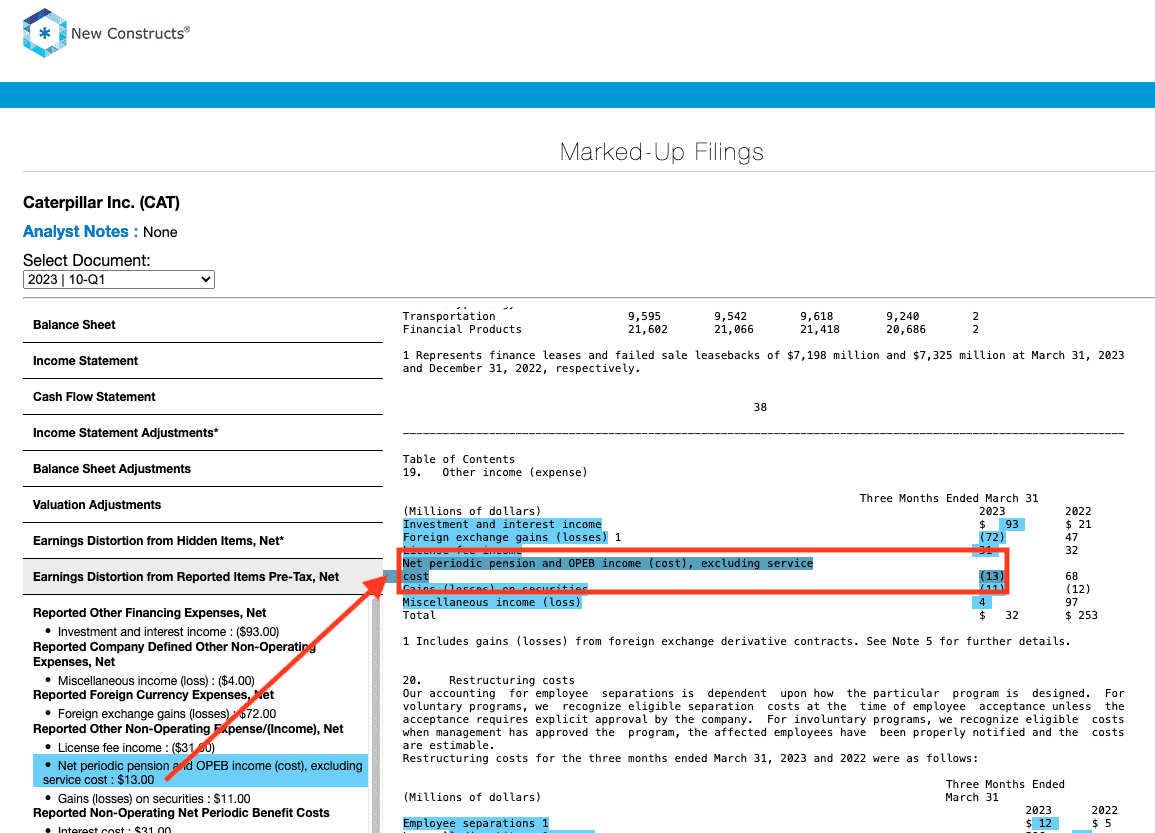
- -$72 million loss in 1Q23
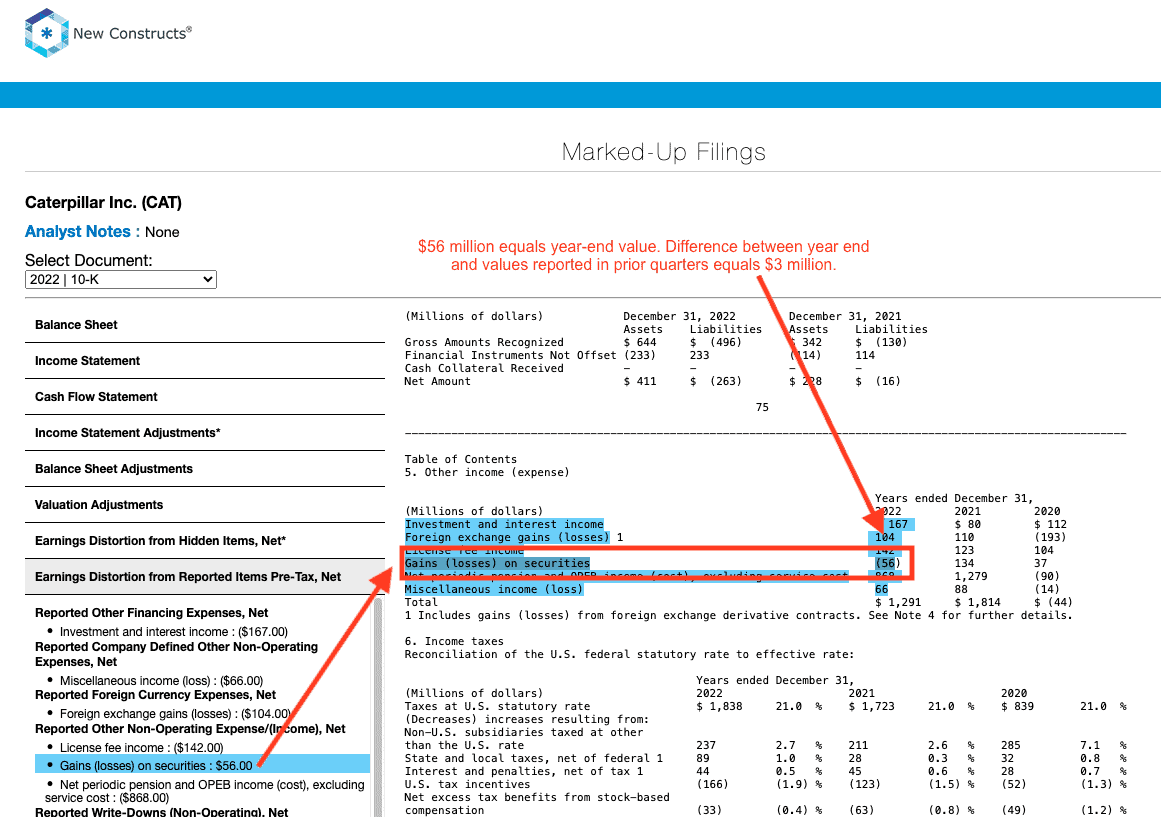
- -$301 million loss in 4Q22
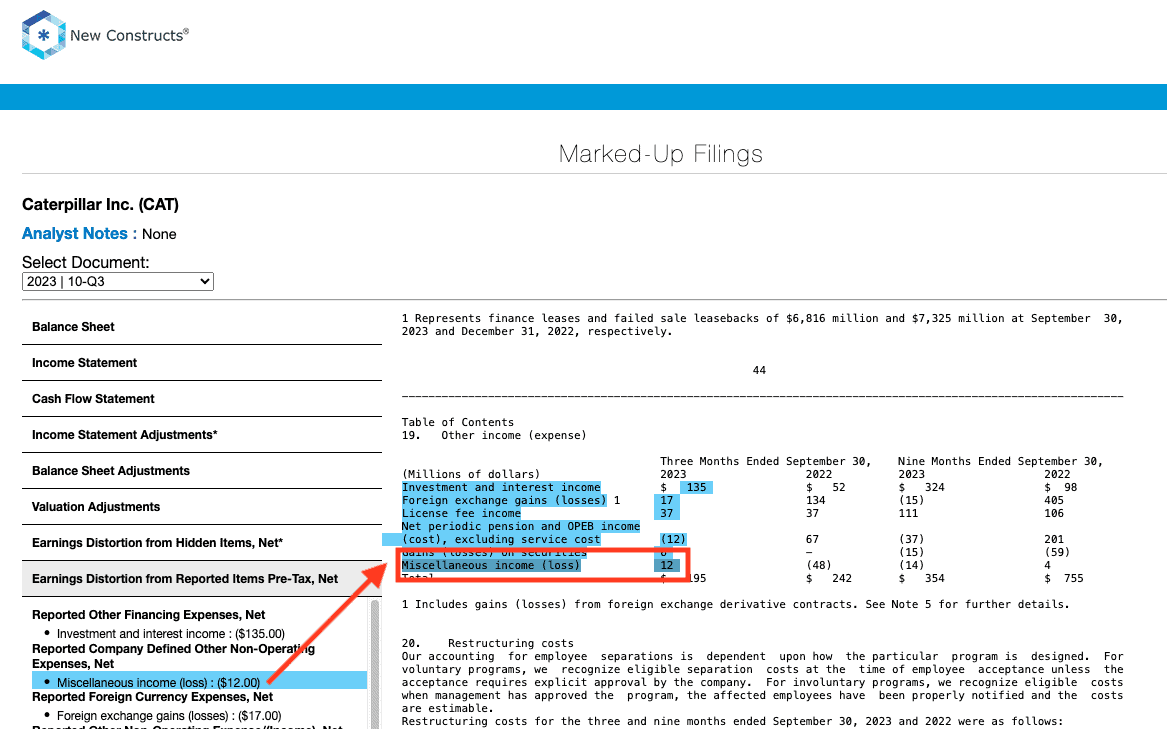
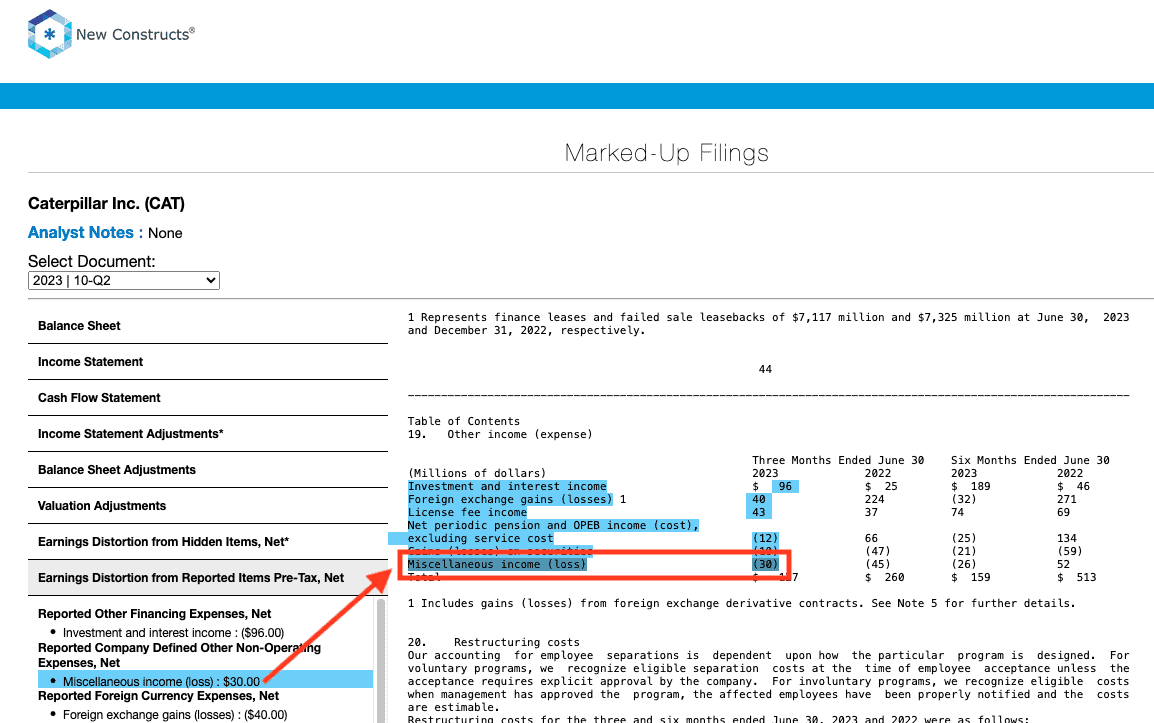
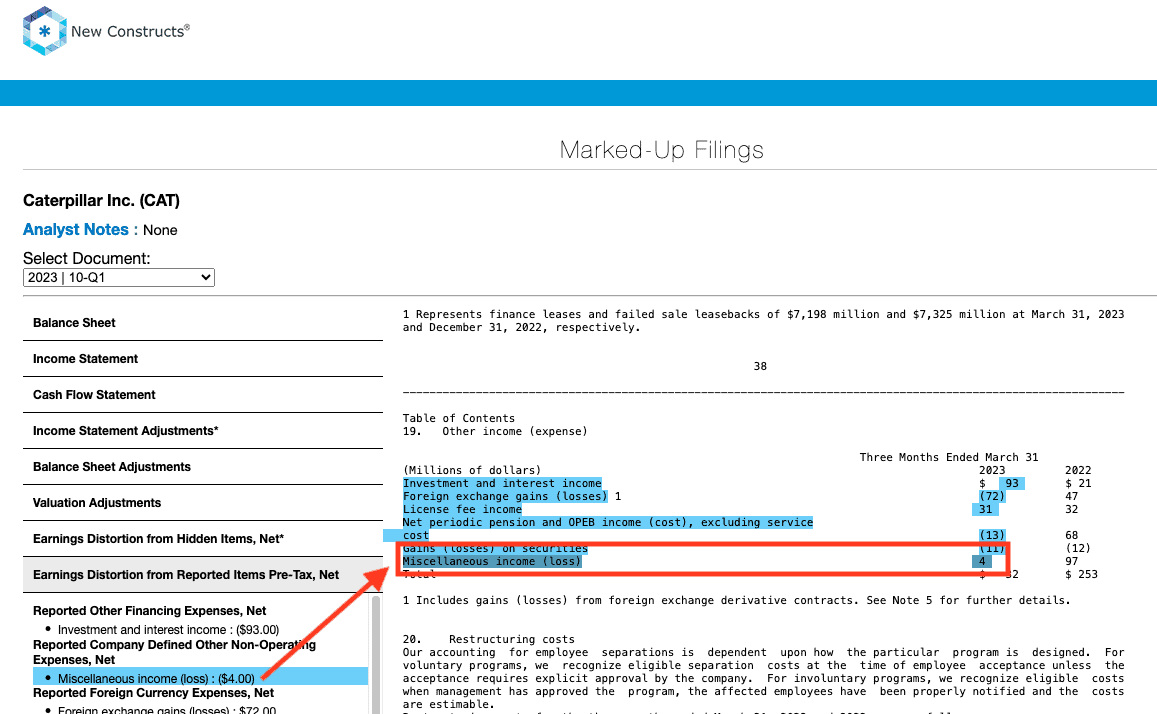
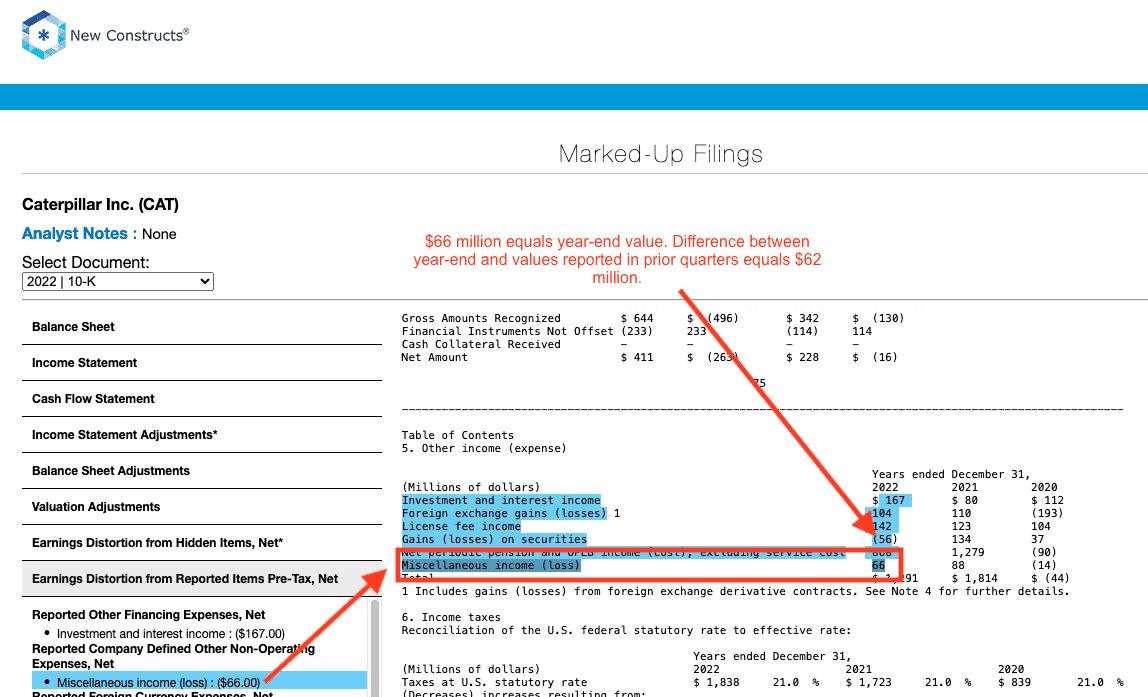
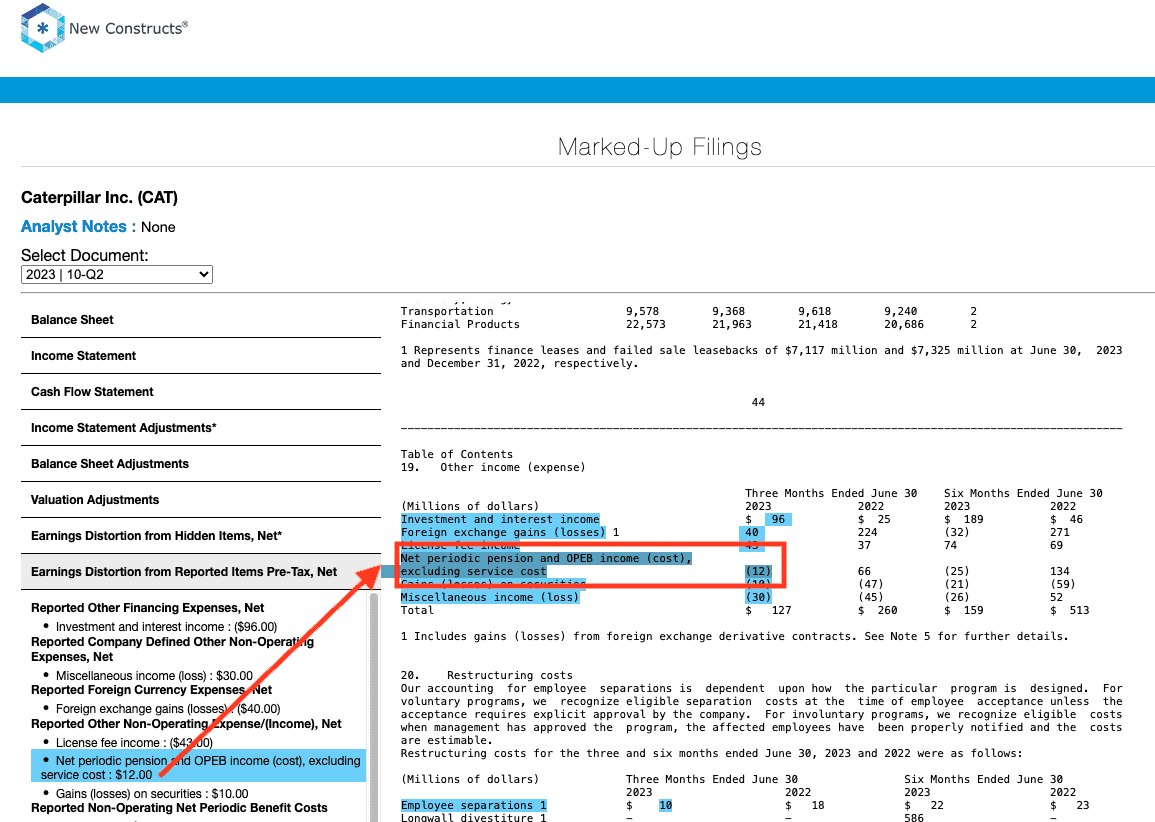
- $48 million in miscellaneous income in the TTM period based on
- $12 million income in 3Q23
- -$30 million loss in 2Q23
- $4 million income in 1Q23
- $62 million income in 4Q22
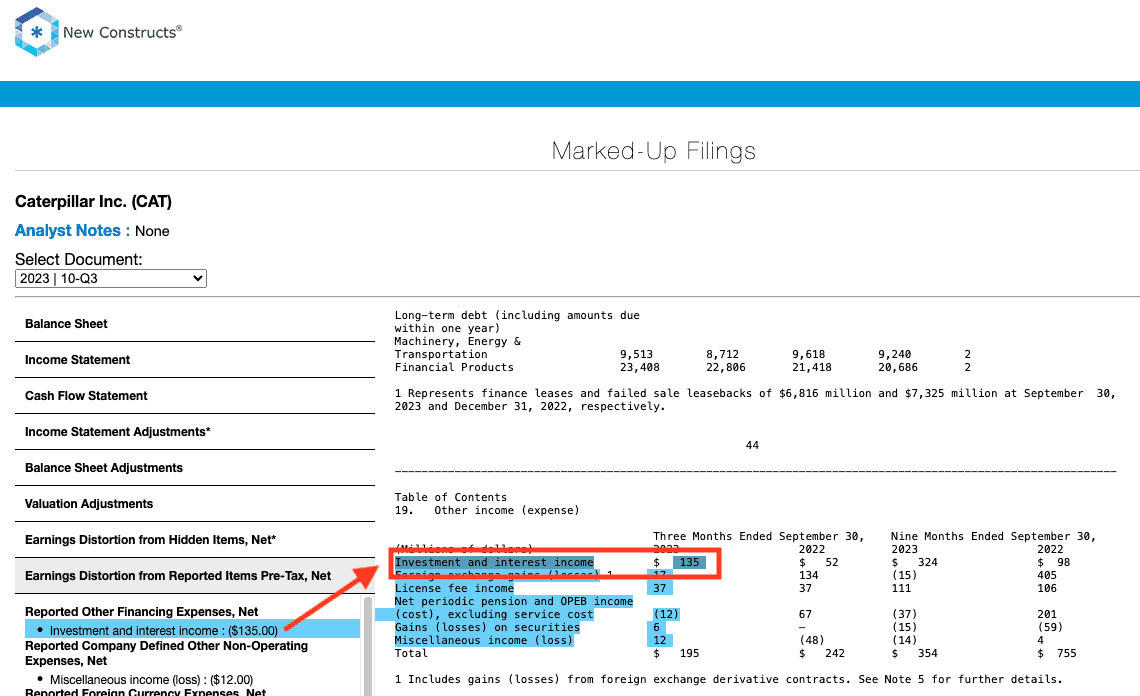
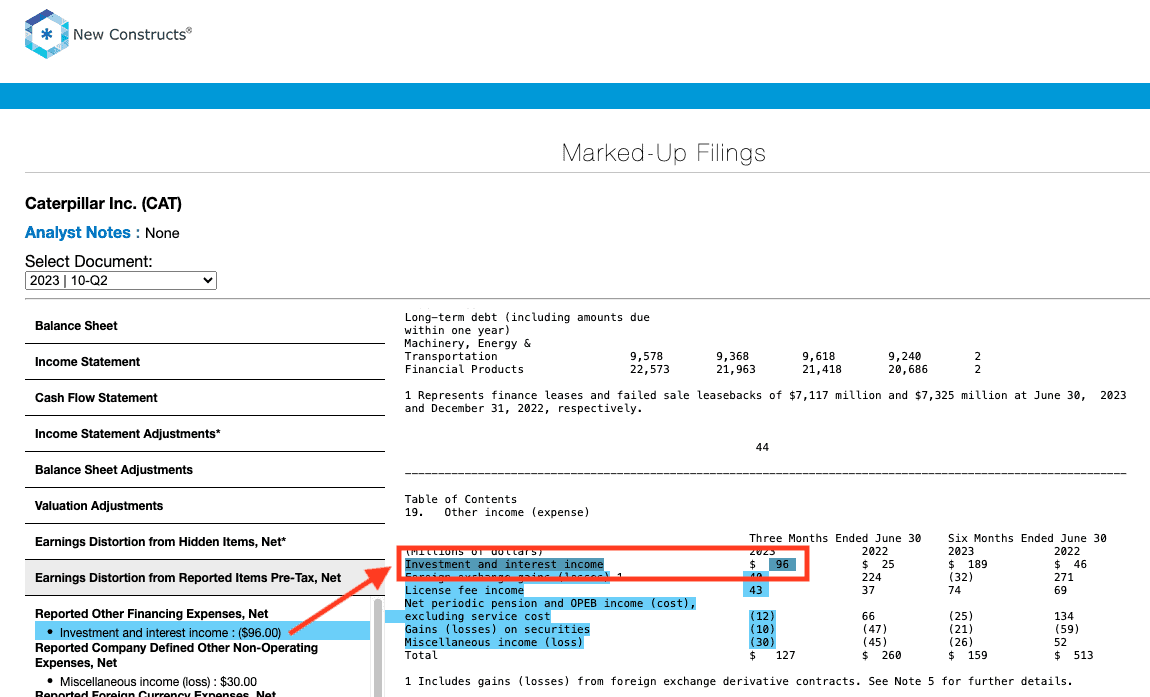
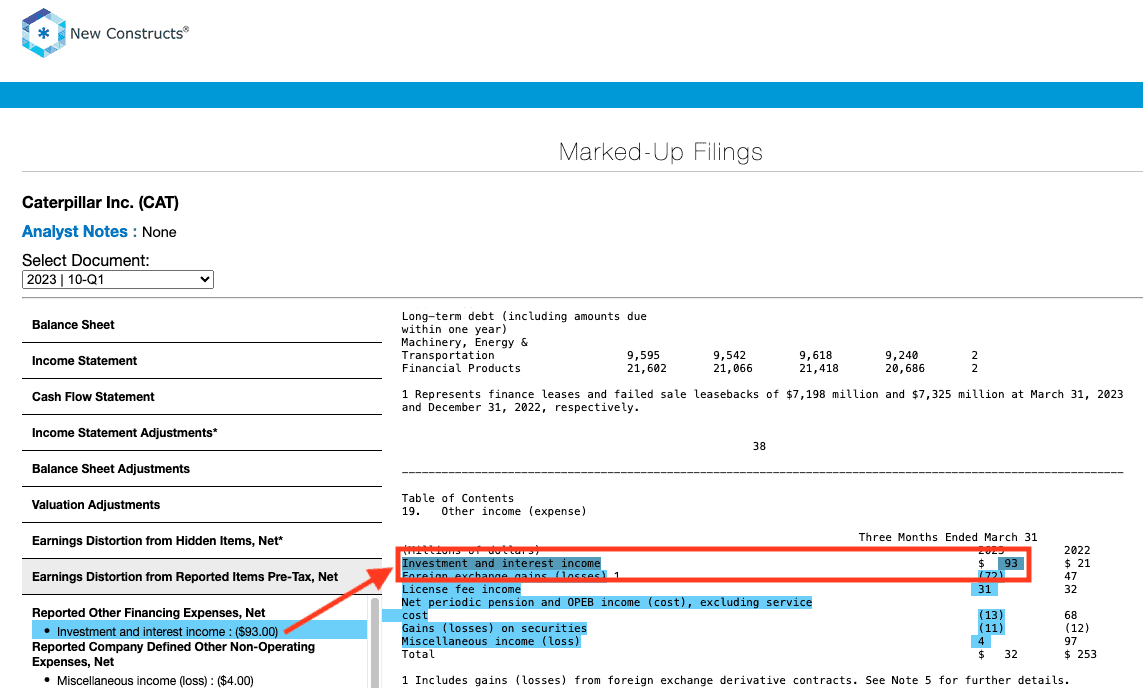
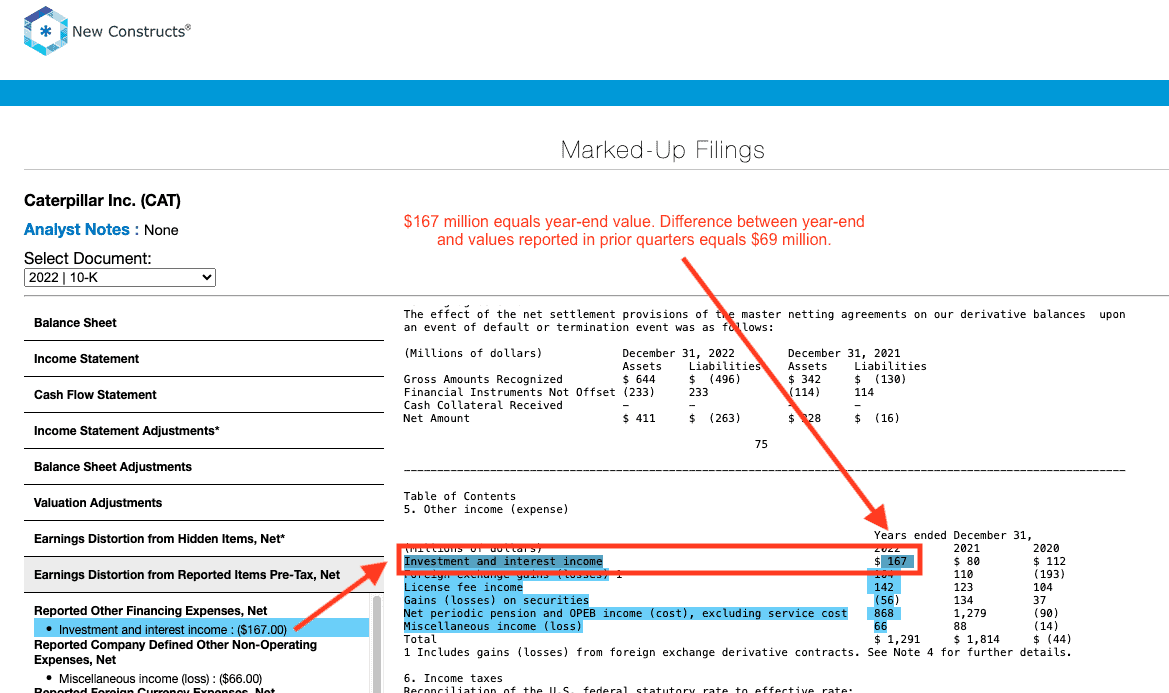
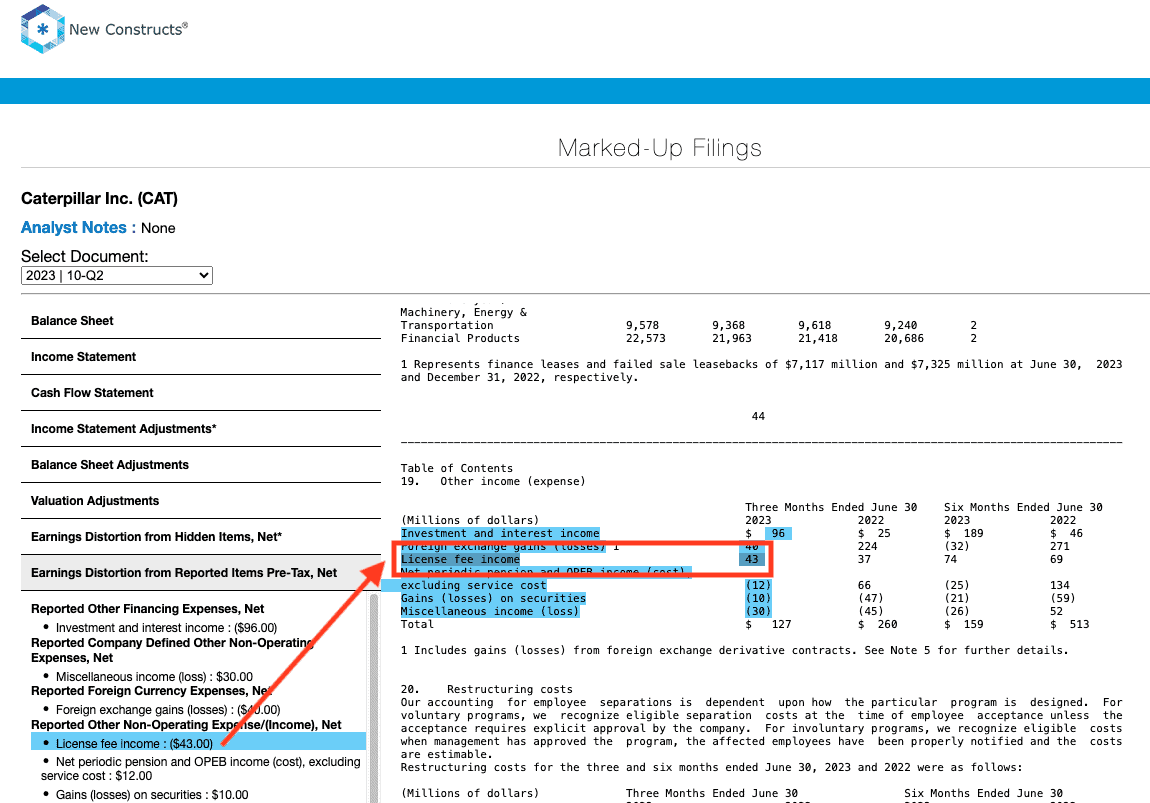
- $393 million in investment and interest income in the TTM period based on
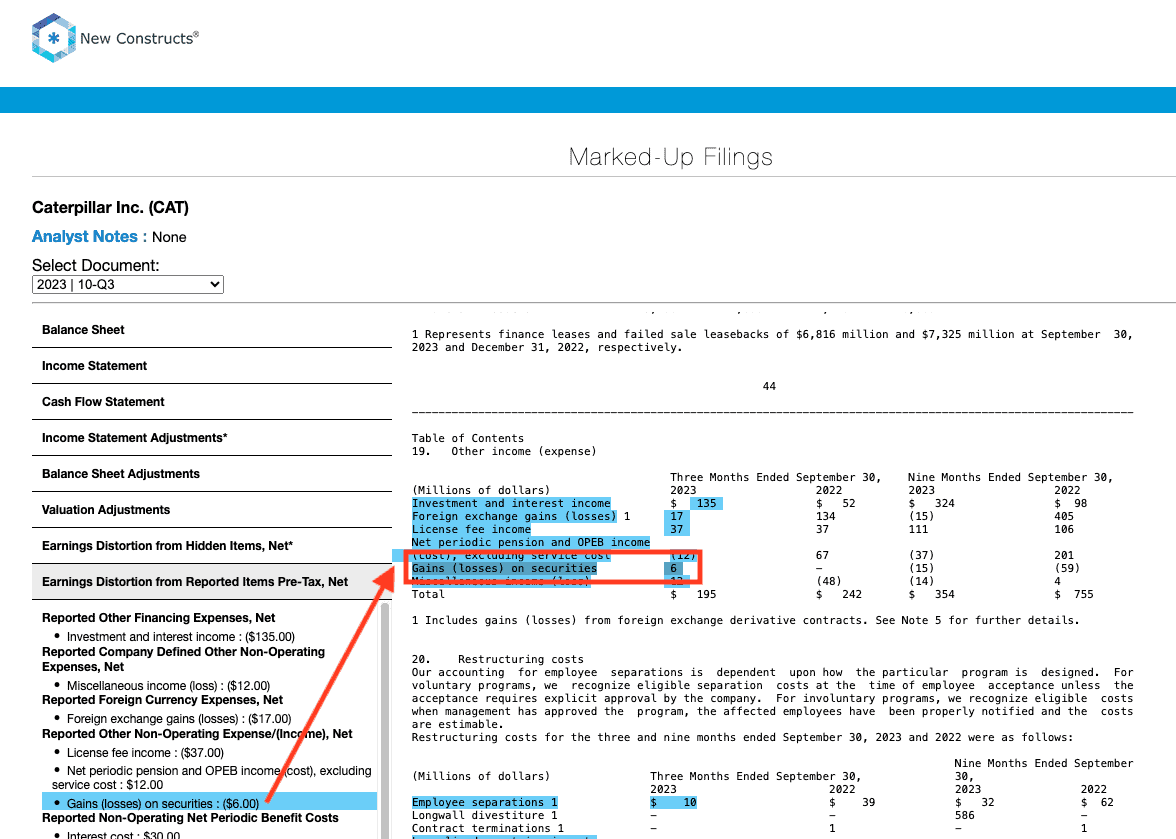
- $135 million in 3Q23
- $96 million in 2Q23
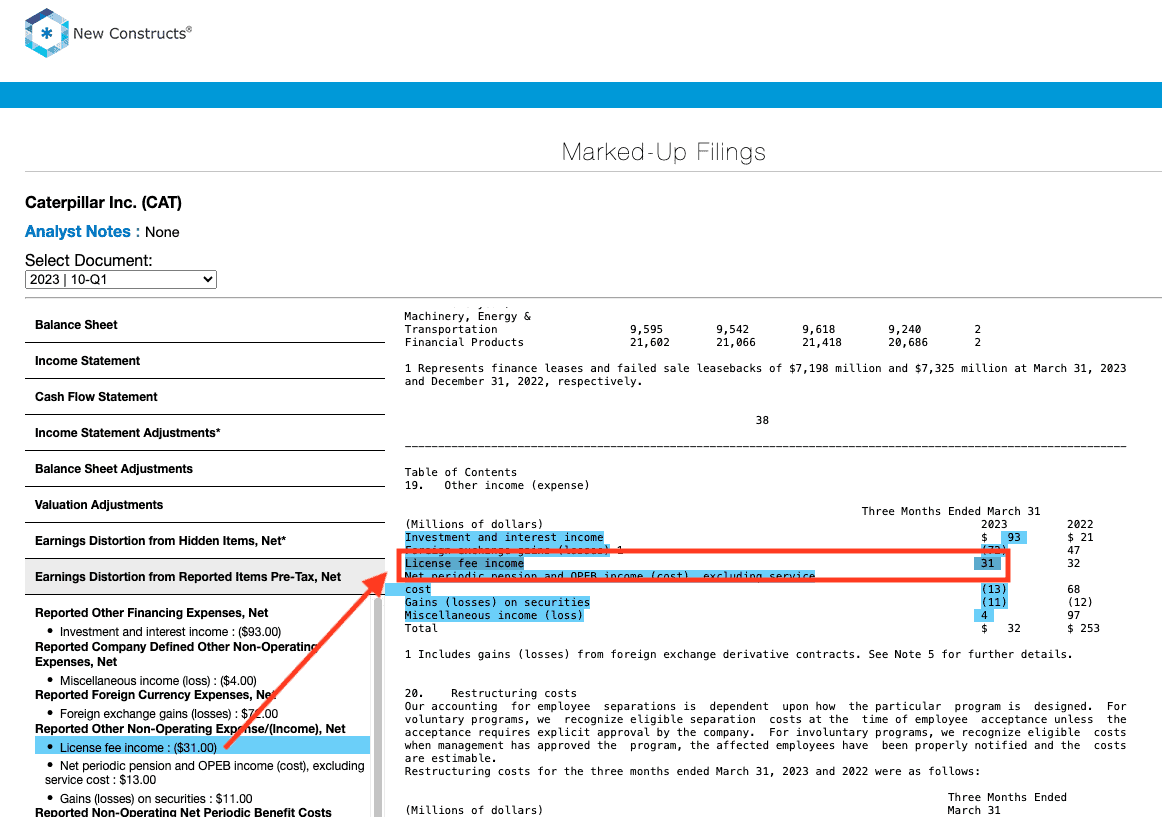
- $93 million in 1Q23
- $69 million in 4Q22
- $765 million in other non-operating income in the TTM period based on
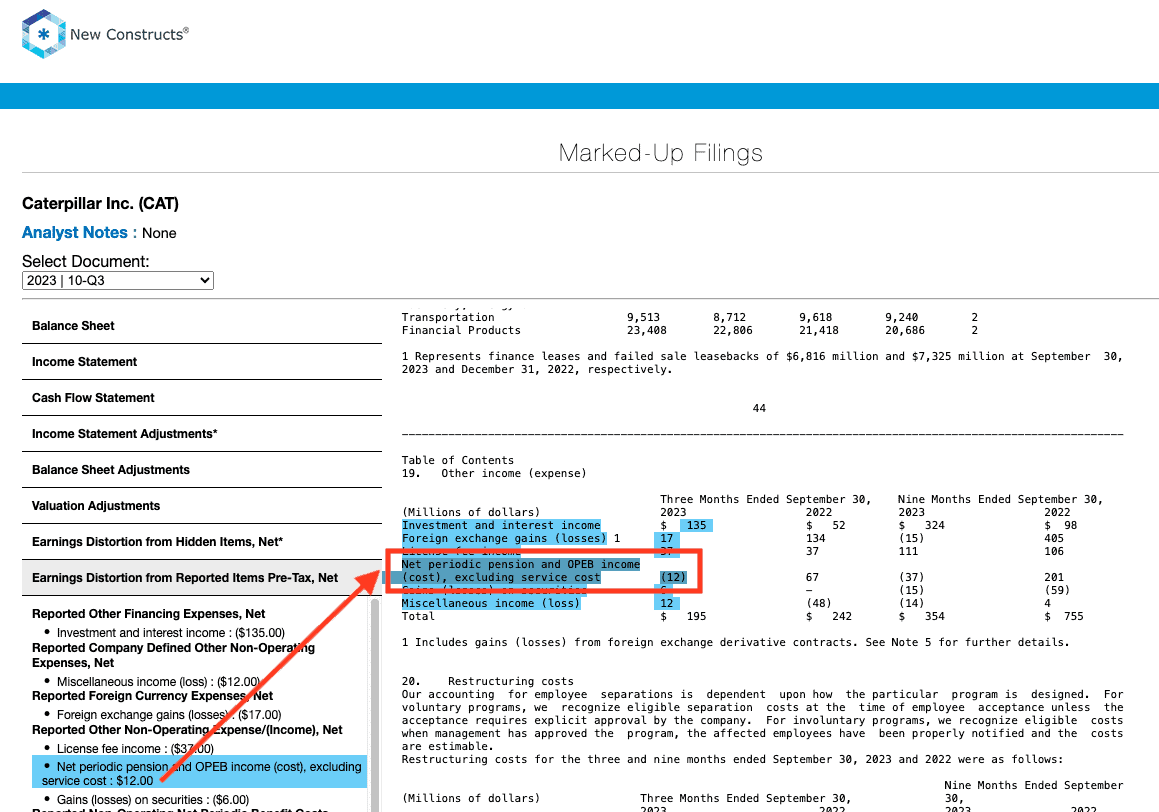
- $630 million in net periodic pension and OPEB income, excluding service cost based on
- -$12 million cost in 3Q23
- -$12 million cost in 2Q23
- -$13 million cost in 1Q23
- $667 million income in 4Q22
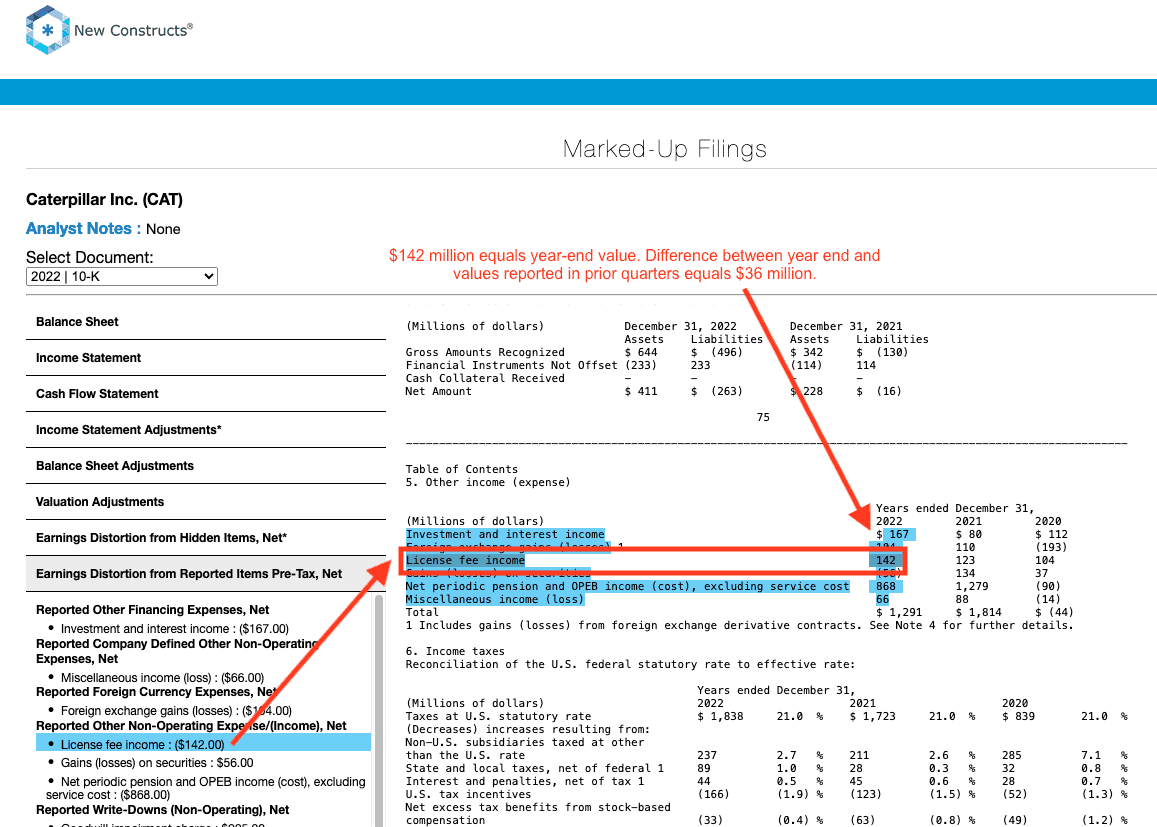
- $147 million in license fee income based on
- $37 million in 3Q23
- $43 million in 2Q23
- $31 million in 1Q23
- $36 million in 4Q22
- -$12 million in losses on securities based on
- $6 million in gains in 3Q23
- -$10 million in losses in 2Q23
- -$11 million in losses in 1Q23
- $3 million in gains in 4Q22
- $630 million in net periodic pension and OPEB income, excluding service cost based on
Tax Distortion = $0.35/per share, which equals $183 million.
This article was originally published on November 29, 2023.
Disclosure: David Trainer, Kyle Guske II, Italo Mendonça, and Hakan Salt receive no compensation to write about any specific stock, style, or theme.
Questions on this report or others? Join our Society of Intelligent Investors and connect with us directly.
Appendix: Calculation Methodology
We derive the Core Earnings and GAAP Earnings metrics above by summing the Trailing Twelve Month individual S&P 500 constituent values for Core Earnings and GAAP Earnings in each sector for each measurement period. We call this approach the “Aggregate” methodology.
The Aggregate methodology provides a straightforward look at the entire sector, regardless of market cap or index weighting and matches how S&P Global (SPGI) calculates metrics for the S&P 500.
[1] The Journal of Financial Economics features the superiority of our Core Earnings in Core Earnings: New Data & Evidence.
[2] Based on the latest audited financial data, which is the calendar 2Q23 10-Q in most cases. Price data as of 8/15/23.
[3] Our research utilizes our Core Earnings, a more reliable measure of profits, as proven in Core Earnings: New Data & Evidence, written by professors at Harvard Business School (HBS) & MIT Sloan and published in The Journal of Financial Economics.
[4] Overstated companies include all companies with Earnings Distortion >0.1% of GAAP earnings.
[5] 320 companies reported GAAP Earnings below Core Earnings in the TTM ended 2Q23.
[6] The full version of this report provides analysis for all eleven sectors.