
Trailing-twelve-month (TTM) return on invested capital (ROIC) for the S&P 500 fell quarter-over-quarter (QoQ) in 2Q23. The continuing decline suggests that the corporate sector of the economy is slowing. More importantly, tepid earnings forecasts for 2H23 suggest that ROIC will not move materially higher from current levels for the foreseeable future. As we mentioned in last quarter’s analysis, we think ROIC for the S&P 500 peaked in 2Q22.
Despite the overall decline, seven out of eleven S&P 500 sectors saw a QoQ rise in ROIC in 2Q23. However, the rise in ROIC in these sectors was small relative to the sectors with declining ROIC. The decline in the S&P 500’s ROIC comes from a deterioration in net operating profit after tax (NOPAT) margins while invested capital turns remained flat.
This report is a free and abridged version of S&P 500 & Sectors: ROIC Keeps Falling In 2Q23, one of our quarterly reports on fundamental market and sector trends. The full report is available to our new Professional and Institutional members.
The full version of this report presents the drivers[1],[2] of economic earnings [ROIC, NOPAT margin, invested capital turns, and weighted average cost of capital (WACC)] for the S&P 500 and each of its sectors (last quarter’s analysis is here). You can find the same analysis on other key metrics here.
This report leverages our cutting-edge Robo-Analyst technology to deliver proven-superior[3] fundamental research and support more cost-effective fulfillment of the fiduciary duty of care.
S&P 500 ROIC Falls in 2Q23
Figure 1 in the full report shows the S&P 500’s ROIC every quarter over the last twenty years. We provide the same analysis for S&P 500’s NOPAT margin and invested capital turns.
Key observations:
We’ve previously noted the “record” return on invested capital of 2Q22 was a mirage and that the bullish trend in ROIC could reverse soon. As we see in 2Q23, margins and ROIC for the S&P 500 continue to fall further from those record highs. Companies continue to note that margins will be pressured in 2023, which could drive ROIC even lower.
WACC for the S&P 500 decreased QoQ for the first time after previously increasing QoQ in eight consecutive quarters. The high cost of capital threatens investor confidence in the viability of many weaker companies, several of which we’ve highlighted in our Zombie Stocks reports.
Beneath the surface, performance by sector is all over the map. Per Figure 2, some sectors saw ROIC rise while others saw it fall. Digging deeper and looking at the drivers of ROIC, NOPAT margins and invested capital turns, we see wildly different results in different sectors.
This variance signals a lot of churn at the company level, which we expect will weed out many weaker companies throughout the remainder of 2023.
See Figure 1 in the full version of our report for the chart of ROIC and WACC for the S&P 500 from December 2004 through 8/15/23.
Key Details on Select S&P 500 Sectors
Seven sectors saw a quarter-over-quarter (QoQ) increase in ROIC.
The Consumer Cyclicals sector performed best in the second quarter of 2023 as measured by change in ROIC, with its ROIC rising 24 basis points from 1Q23.
The biggest loser in the second quarter was the Energy sector. ROIC for the Energy sector declined 237 basis points QoQ in 2Q23.
Below, we highlight the Energy sector, which had the largest decline in ROIC in 2Q23.
Sample Sector Analysis[4]: Energy
Figure 1 shows the Energy sector’s ROIC fell from 13.2% in 1Q23 to 10.8% in 2Q23. The Energy sector’s NOPAT margin fell from 15.4% in 1Q23 to 13.9% in 2Q23, while invested capital turns fell from 0.86 in 1Q23 to 0.78 in 2Q23.
Figure 1: Energy ROIC vs. WACC: December 2004 – 8/15/23
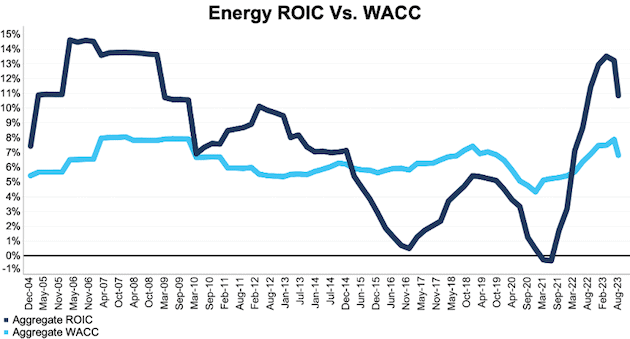
Sources: New Constructs, LLC and company filings.
The August 15, 2023 measurement period uses price data as of that date for our WACC calculation and incorporates the financial data from 2Q23 10-Qs for ROIC, as this is the earliest date for which all the 2Q23 10-Qs for the S&P 500 constituents were available.
Figure 2 compares the trends for NOPAT margin and invested capital turns for the Energy sector since 2004. We sum the individual Energy sector constituent values for revenue, NOPAT, and invested capital to calculate these metrics. We call this approach the “Aggregate” methodology.
Figure 2: Energy NOPAT Margin vs. IC Turns: December 2004 – 5/15/23
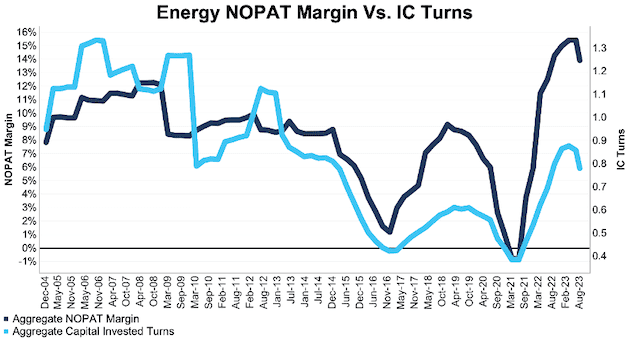
Sources: New Constructs, LLC and company filings.
The August 15, 2023 measurement period uses price data as of that date for our WACC calculation and incorporates the financial data from 2Q23 10-Qs for ROIC, as this is the earliest date for which all the 2Q23 10-Qs for the S&P 500 constituents were available.
The Aggregate methodology provides a straightforward look at the entire sector, regardless of market cap or index weighting. The methodology matches how S&P Global (SPGI) calculates metrics for the S&P 500.
For additional perspective, we compare the Aggregate method for ROIC with two market-weighted methodologies: market-weighted metrics and market-weighted drivers. Each method has its pros and cons, which are detailed in the Appendix.
Figure 3 compares these three methods for calculating the Energy sector ROIC.
Figure 3: Energy ROIC Methodologies Compared: December 2004 – 8/15/23
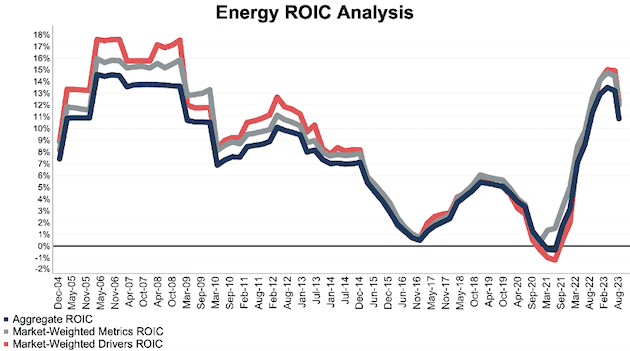
Sources: New Constructs, LLC and company filings.
The August 15, 2023 measurement period uses price data as of that date for our WACC calculation and incorporates the financial data from 2Q23 10-Qs for ROIC, as this is the earliest date for which all the 2Q23 10-Qs for the S&P 500 constituents were available.
This article was originally published on August 25, 2023.
Disclosure: David Trainer, Kyle Guske II, Italo Mendonca, and Hakan Salt receive no compensation to write about any specific stock, style, or theme.
Questions on this report or others? Join our Society of Intelligent Investors and connect with us directly.
Appendix: Analyzing ROIC with Different Weighting Methodologies
We derive the metrics above by summing the individual S&P 500 constituent values for revenue, NOPAT, and invested capital to calculate the metrics presented. We call this approach the “Aggregate” methodology.
The Aggregate methodology provides a straightforward look at the entire sector, regardless of market cap or index weighting and matches how S&P Global (SPGI) calculates metrics for the S&P 500.
For additional perspective, we compare the Aggregate method for ROIC with two other market-weighted methodologies:
- Market-weighted metrics – calculated by market-cap-weighting the ROIC for the individual companies relative to their sector or the overall S&P 500 in each period. Details:
- Company weight equals the company’s market cap divided by the market cap of the S&P 500/its sector
- We multiply each company’s ROIC by its weight
- S&P 500/Sector ROIC equals the sum of the weighted ROICs for all the companies in the S&P 500/each sector
- Market-weighted drivers – calculated by market-cap-weighting the NOPAT and invested capital for the individual companies in each sector in each period. Details:
- Company weight equals the company’s market cap divided by the market cap of the S&P 500/its sector
- We multiply each company’s NOPAT and invested capital by its weight
- We sum the weighted NOPAT and invested capital for each company in the S&P 500/each sector to determine each sector’s weighted NOPAT and weighted invested capital
- S&P 500/Sector ROIC equals weighted sector NOPAT divided by weighted sector invested capital
Each methodology has its pros and cons, as outlined below:
Aggregate method
Pros:
- A straightforward look at the entire S&P 500/sector, regardless of company size or weighting.
- Matches how S&P Global calculates metrics for the S&P 500.
Cons:
- Vulnerable to impact of by companies entering/exiting the group of companies, which could unduly affect aggregate values despite the level of change from companies that remain in the group.
Market-weighted metrics method
Pros:
- Accounts for a firm’s size relative to the overall S&P 500/sector and weights its metrics accordingly.
Cons:
- Vulnerable to outsized impact of one or a few companies, as shown in the full report. This outsized impact tends to occur only for ratios where unusually small denominator values can create extremely high or low results.
Market-weighted drivers method
Pros:
- Accounts for a firm’s size relative to the overall S&P 500/sector and weights its NOPAT and invested capital accordingly.
- Mitigates potential outsized impact of one or a few companies by aggregating values that drive the ratio before calculating the ratio.
Cons:
- Can minimize the impact of period-over-period changes in smaller companies, as their impact on the overall sector NOPAT and invested capital is smaller.
[1] Calculated using SPGI’s methodology, which sums individual S&P 500 constituent values for NOPAT and invested capital. See Appendix III for more details on this “Aggregate” method and Appendix I for details on how we calculate WACC for the S&P 500 and each of its sectors.
[2] This report is based on the latest audited financial data available, which is the 2Q23 10-Q in most cases. Price data is as of 8/15/23.
[3] Our research utilizes our Core Earnings, a more reliable measure of profits, as proven in Core Earnings: New Data & Evidence, written by professors at Harvard Business School (HBS) & MIT Sloan and published in The Journal of Financial Economics.
[4] The full version of this report provides analysis for every sector like what we show for this sector.