
Street Earnings, as reflected in Zacks Earnings, are marketed as being adjusted to remove unusual income and charges. Our Core Earnings[1] show Street Earnings fail to account for a material amount of unusual income and charges, which distorts investors’ view of profitability across the S&P 500. This report shows:
- the prevalence and magnitude of overstated Street Earnings in the S&P 500,
- why Street Earnings (and GAAP earnings) are flawed and not adjusted as promised, and
- five S&P 500 companies with overstated Street Earnings and a Very Unattractive Stock Rating.
199 S&P 500 Companies Overstate EPS by More than 10%
For 363 companies in the S&P 500, or 73%, Street Earnings are higher than Core Earnings[2] for the trailing-twelve-months (TTM) ended 3Q23. In the TTM ended 2Q23, 357 companies overstated their earnings.
When Street Earnings are higher than Core Earnings, they are overstated by an average of 22%, per Figure 1.
Figure 1: Street Earnings Overstated by 22% on Average in TTM Through 3Q23[3]

Sources: New Constructs, LLC and company filings.
The 363 companies with overstated Street Earnings make up 75% of the market cap of the S&P 500 as of 11/14/23, which is up from 70% in 2Q23.
Note that this analysis is based on our team analyzing the financial statements and footnotes for ~3,000 10-Ks and 10-Qs filed with the SEC in the last few weeks. We estimate that the cost of this work for most firms would be around $1 million each quarter. To say the least, there is tremendous value in our rigorous analysis of these filings across so many companies so that our clients can discern the best and worst stocks with unrivaled diligence.
Figure 2: Overstated Street Earnings as % of Market Cap: 2012 through 11/14/23
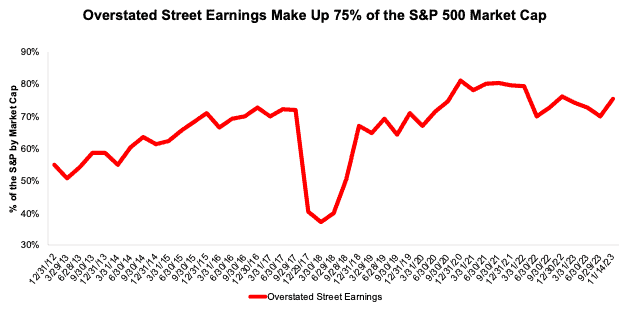
Sources: New Constructs, LLC and company filings.
For over a third of the S&P 500 (199 companies), Street Earnings are overstated by more than 10% vs. Core Earnings. These 199 companies make up 28% of the market cap of the S&P 500 as of 11/14/23. See Figure 3.
Figure 3: Overstated Street Earnings by > 10% as % of Market Cap: 2012 through 11/14/23
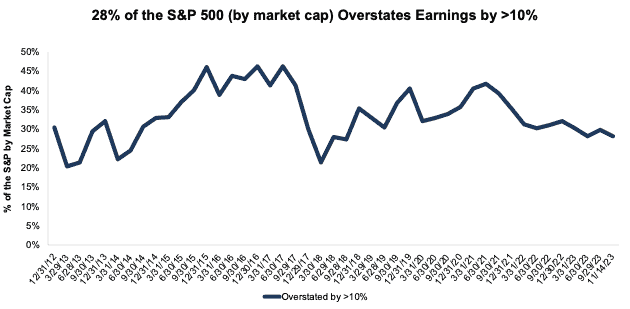
Sources: New Constructs, LLC and company filings.
The Five Worst Offenders in the S&P 500
Figure 4 shows five S&P 500 stocks with an Unattractive-or-worse Stock Rating and the most overstated Street Earnings (Street Distortion as a % of Street Earnings per share) over the TTM through 3Q23. “Street Distortion” equals the difference between Core Earnings per share and Street Earnings per share. Investors using Street Earnings miss the true profitability, or lack thereof, of these businesses.
Figure 4: S&P 500 Companies with Most Overstated Street Earnings: TTM 3Q23
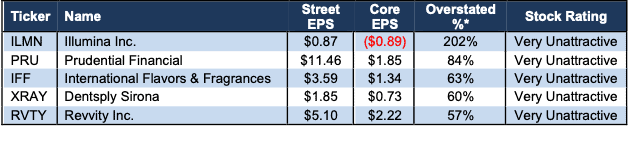
Sources: New Constructs, LLC and company filings.
*Measured as Street Distortion as a percent of Street EPS.
In the section below, we detail the hidden and reported unusual items that distort GAAP Earnings for Revvity (RVTY). All of these unusual income and charges are removed from Core Earnings.
Revvity’s 3Q23 TTM Street Earnings Overstated by $2.88/share
The difference between, or Street Distortion in, Revvity’s Street Earnings ($5.10/share) and Core Earnings ($2.22/share) is $2.88/share, or 57% percent of Street Earnings.
Revvity’s GAAP Earnings Distortion is higher at $3.69/share, which indicates that Street Earnings are identifying some non-operating and unusual items. However, given the disconnect between Street and Core Earnings, it’s clear that Street Earnings still miss material unusual items.
Figure 5: Comparing Revvity’s GAAP, Street, and Core Earnings: TTM 3Q23
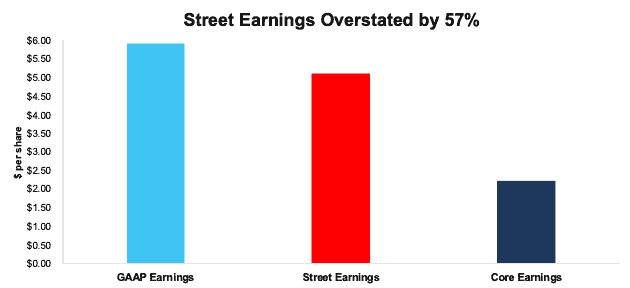
Sources: New Constructs, LLC and company filings.
Below, we detail the differences between Core Earnings and GAAP Earnings so readers can audit our research. We would be happy to reconcile our Core Earnings with Street Earnings but cannot because we do not have the details on how analysts calculate Street Earnings.
Revvity’s Earnings Distortion Score is Strong Miss and its Stock Rating is Very Unattractive. Revvity receives a Very Unattractive rating largely due to its misleading economic earnings, low return on invested capital (ROIC) of 2%, and the expensive valuation of its stock. Despite trading at $89/share, RVTY has an economic book value (EBV), or no-growth value, of $7/share.
Figure 6 details the differences between Revvity’s Core Earnings and GAAP Earnings.
Figure 6: Revvity’s GAAP Earnings to Core Earnings Reconciliation: TTM 3Q23

Sources: New Constructs, LLC and company filings.
More details:
Total Earnings Distortion of $3.69/share, which equals $463.8 million, is comprised of the following:
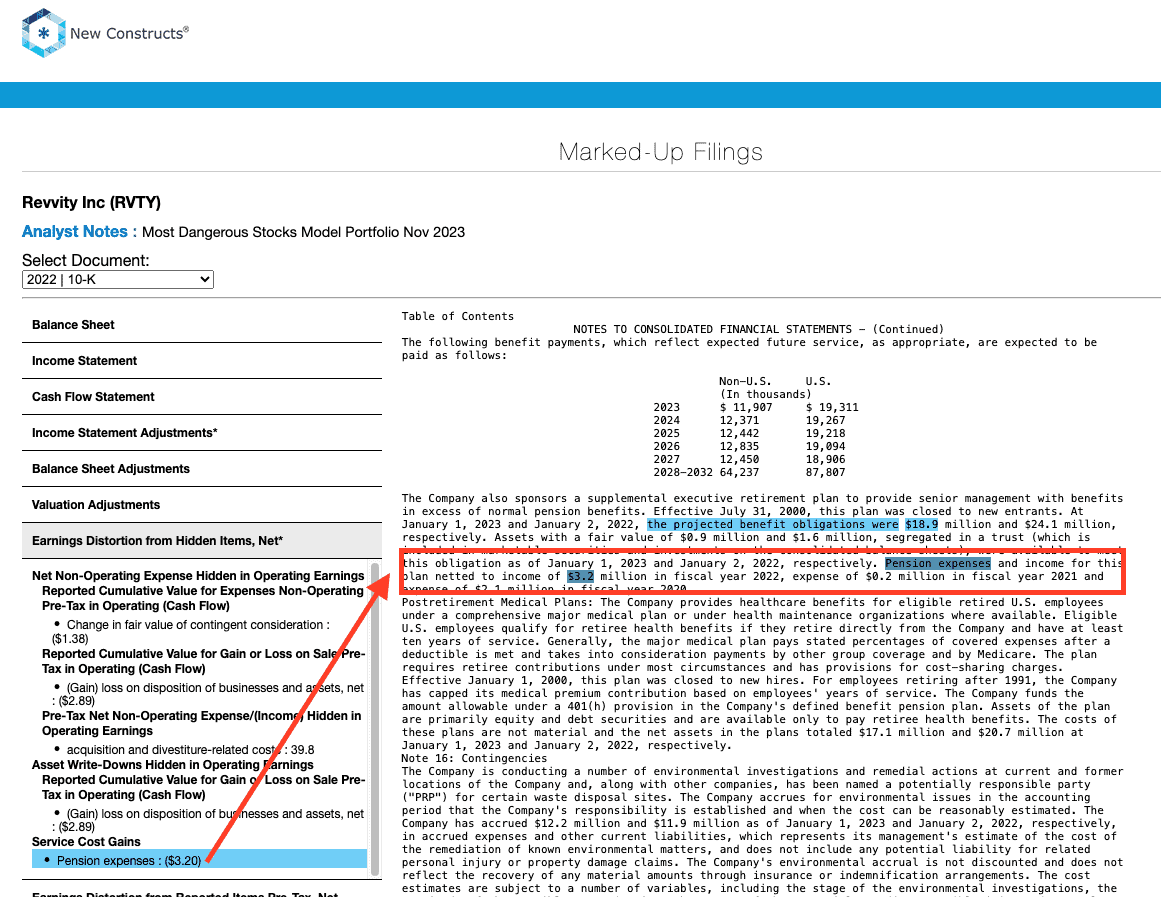
Hidden Unusual Expenses Pre-Tax, Net = -$0.49/share, which equals -$61 million and is comprised of:
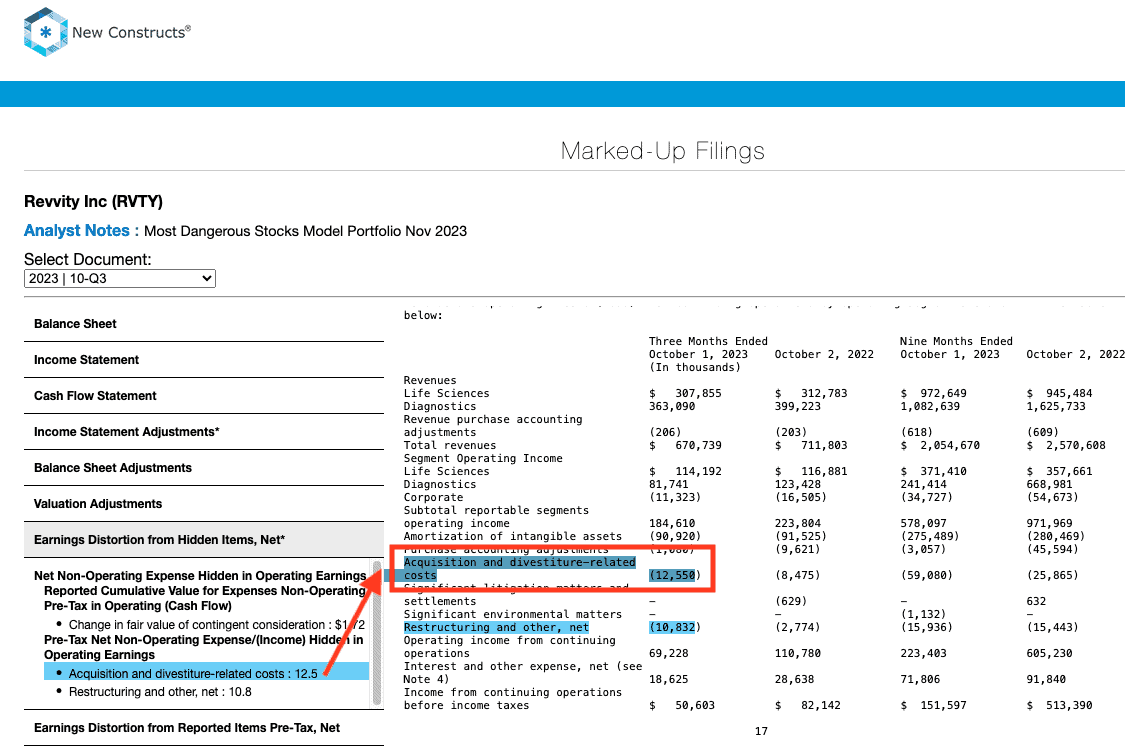
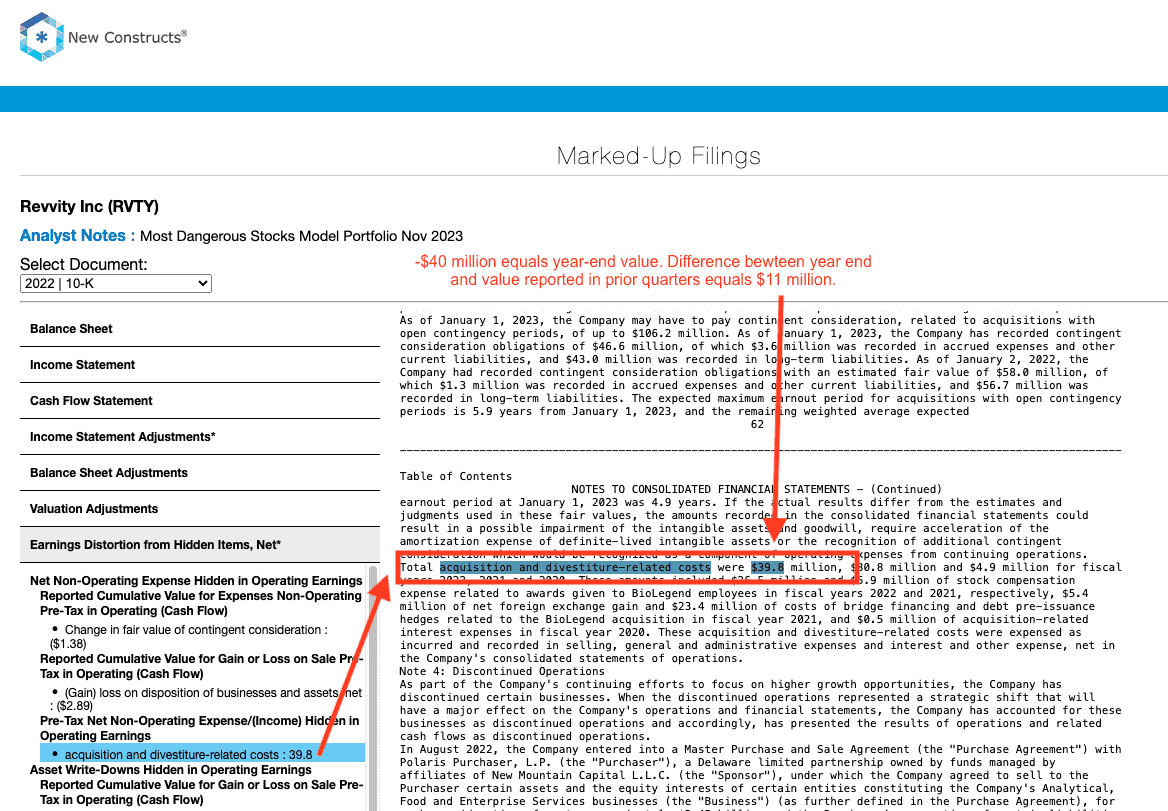
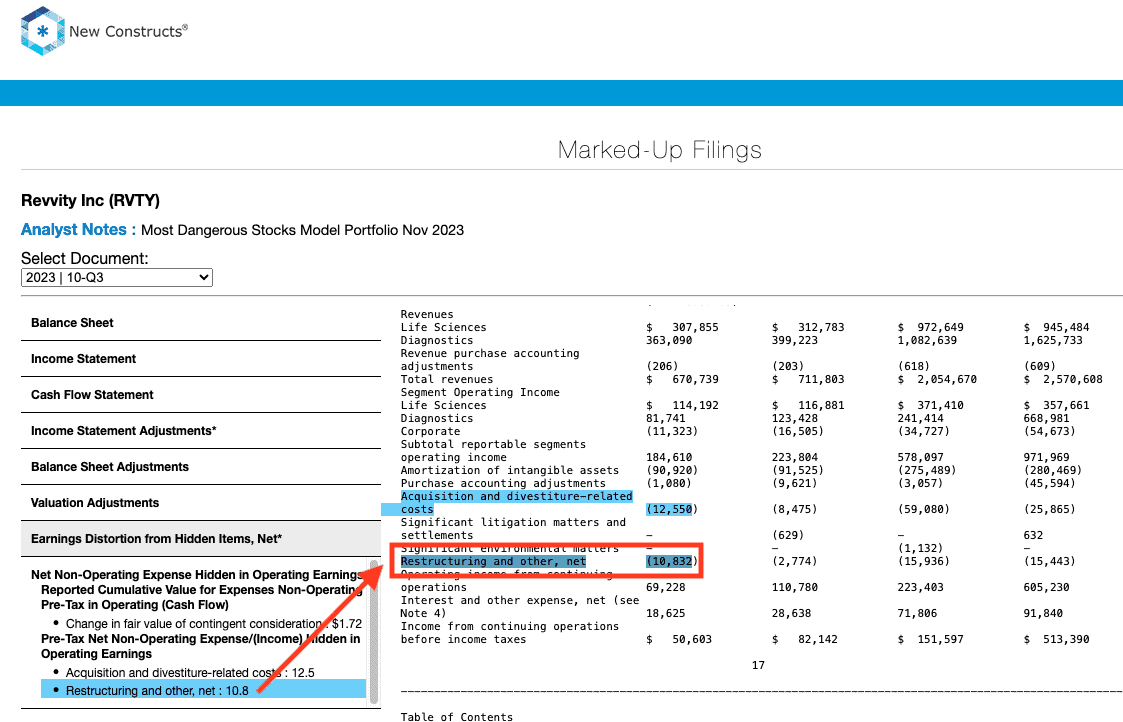
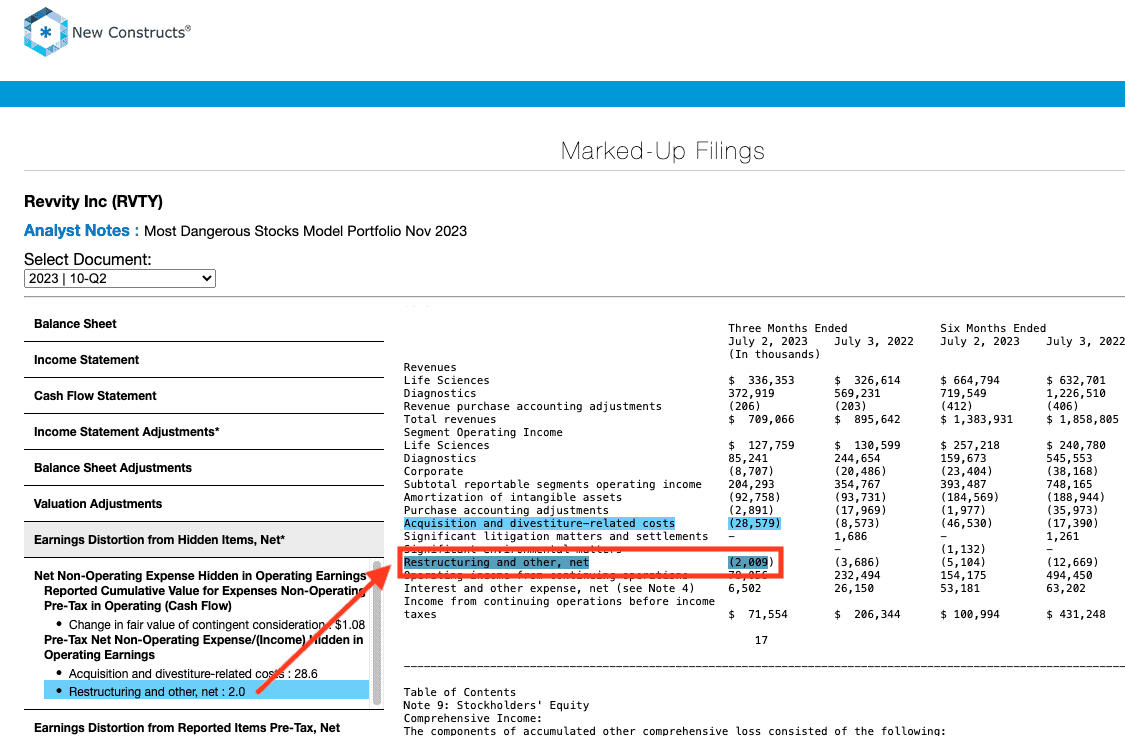
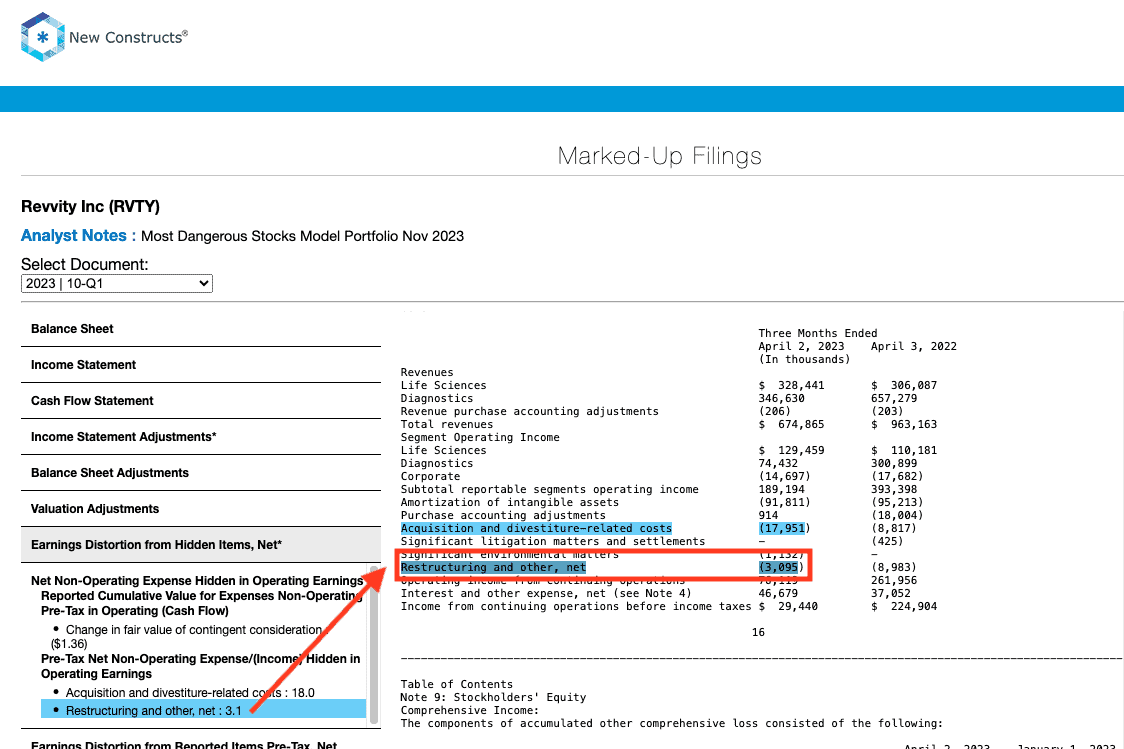
- -$48 million in acquisition and divestiture related costs in the TTM period based on
- -$13 million in costs in 3Q23
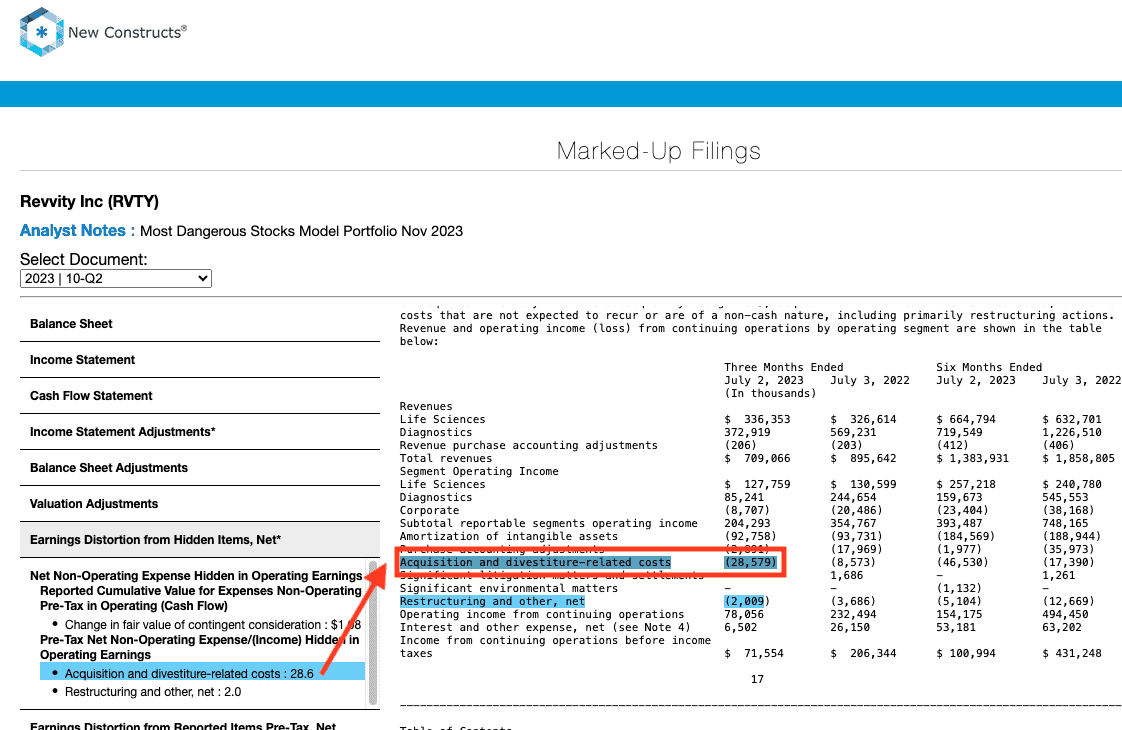
- -$29 million in costs in 2Q23
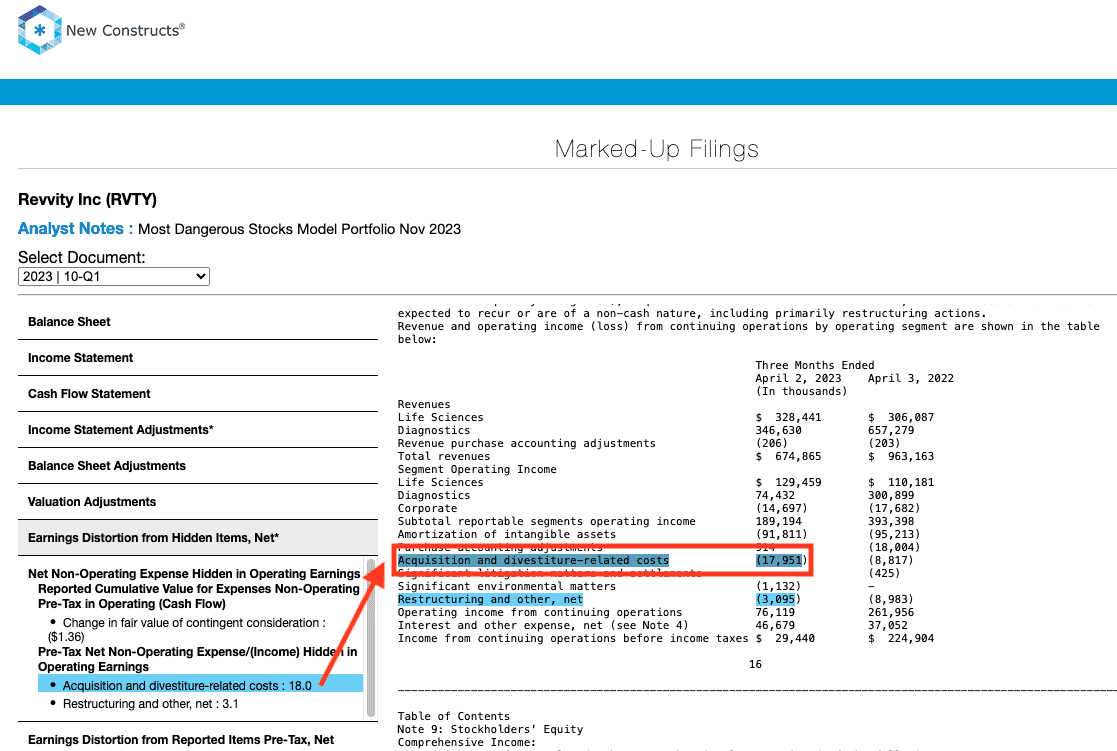
- -$18 million in costs in 1Q23
- $11 million in gains in 4Q22
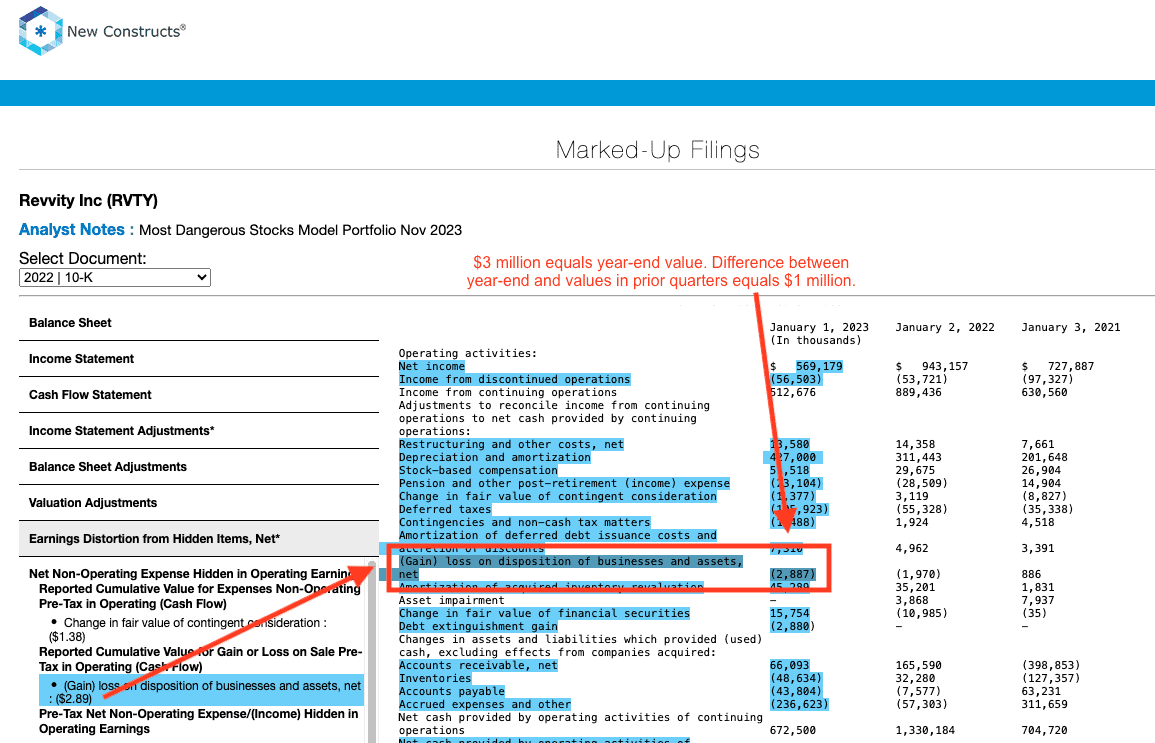
- -$15 million in restructuring and other expenses and gains on disposition of businesses in the TTM period based on
- -$11 million restructuring in 3Q23
- -$2 million restructuring in 2Q23
- -$3 million restructuring in 1Q23
- $1 million gain on disposition of businesses and assets in 4Q22
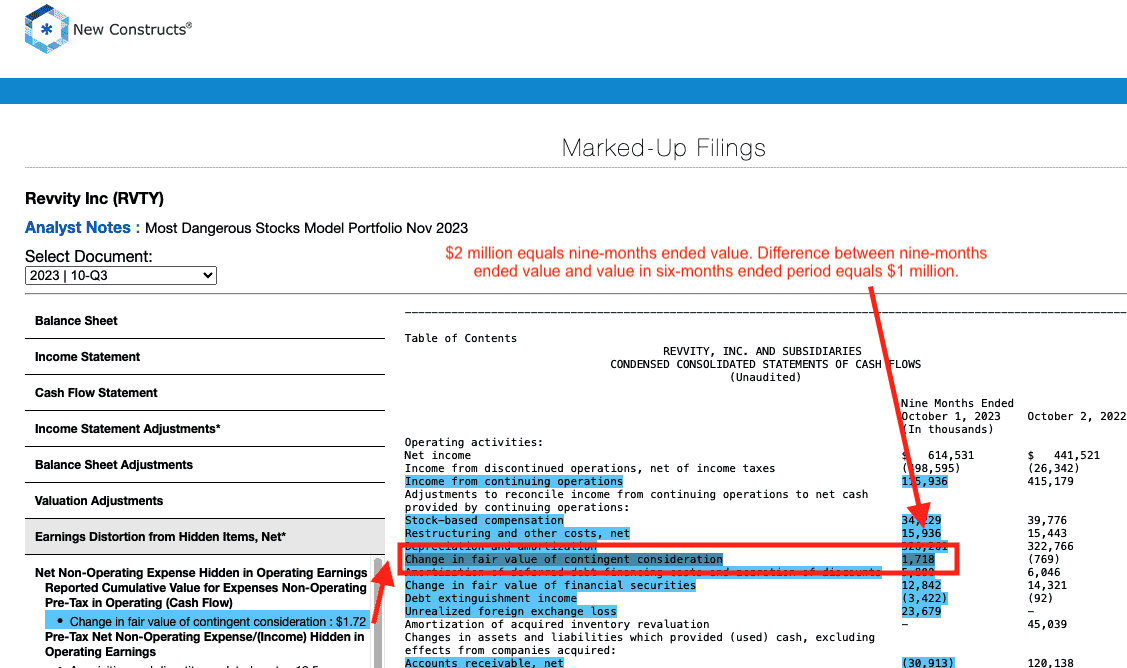
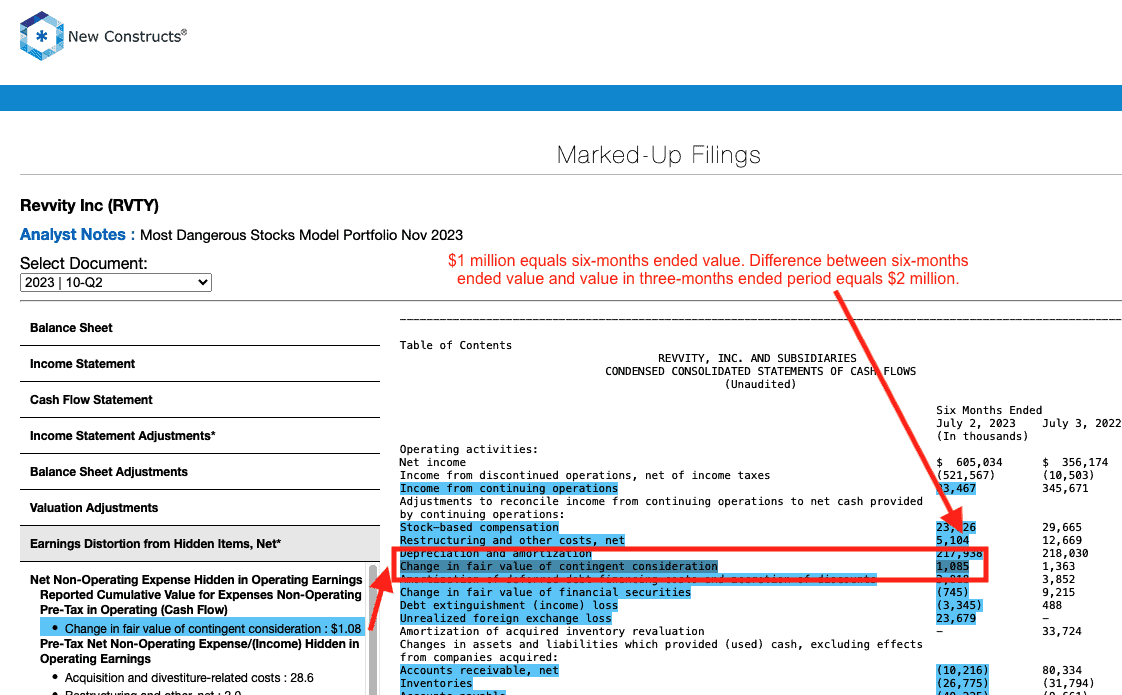
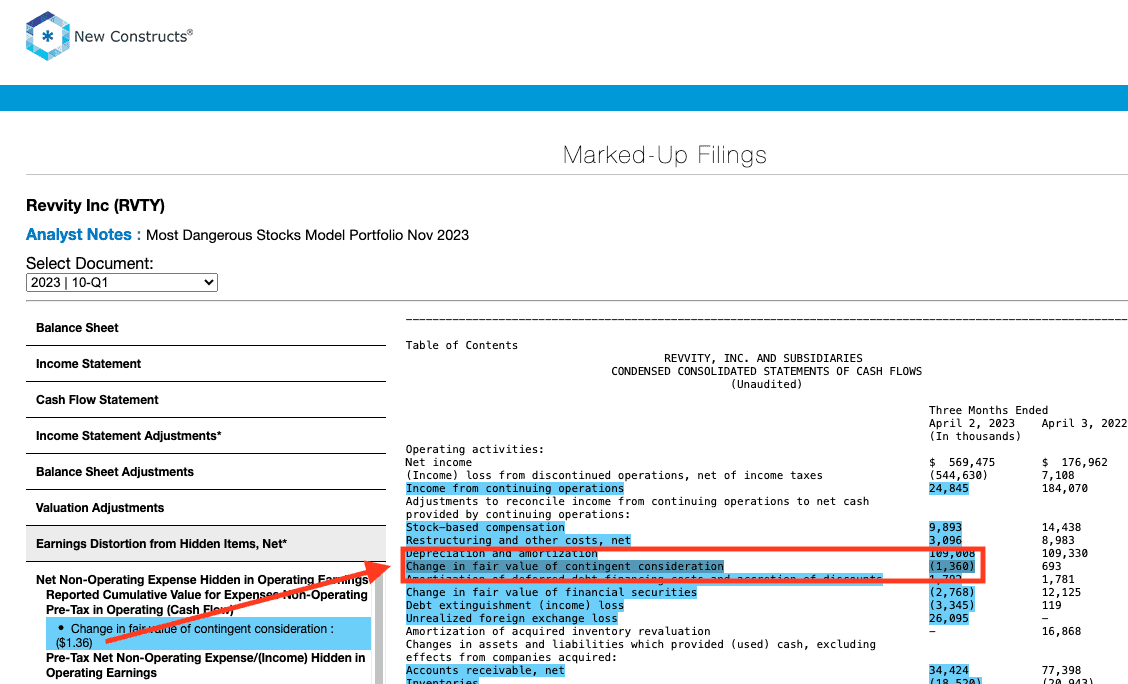
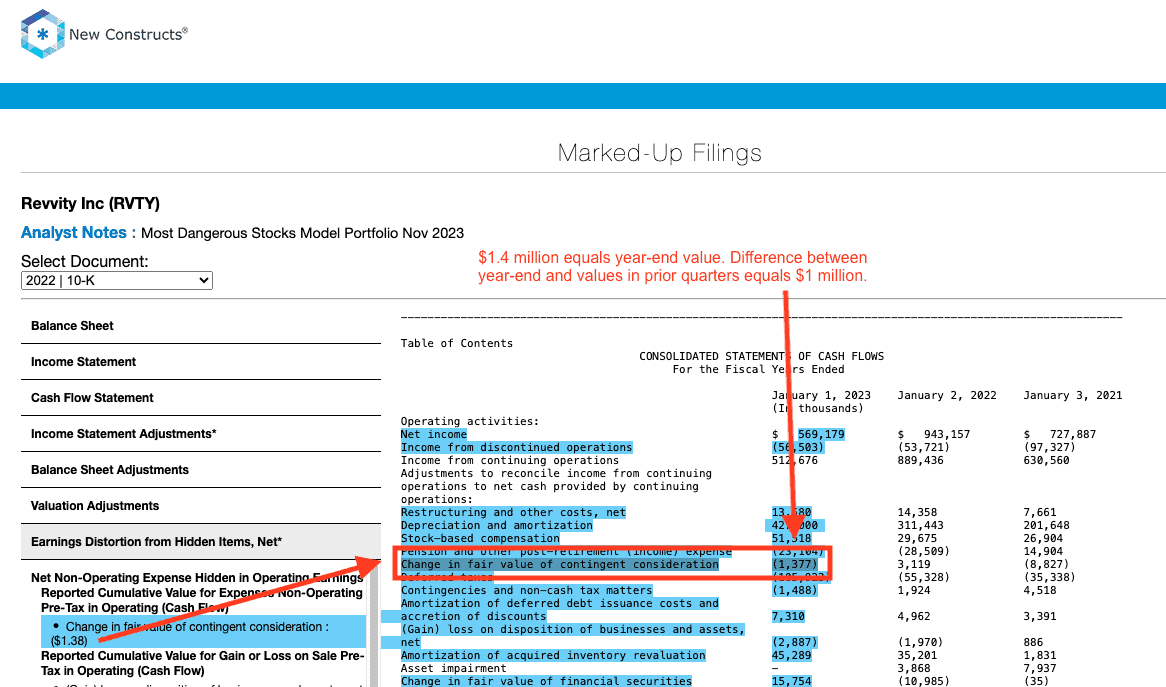
- -$2 million in change in fair value of contingent consideration charges in the TTM period based on
- -$1 million in 3Q23
- -$2 million in 2Q23
- $1 million in 1Q23
- -$1 million in 4Q22
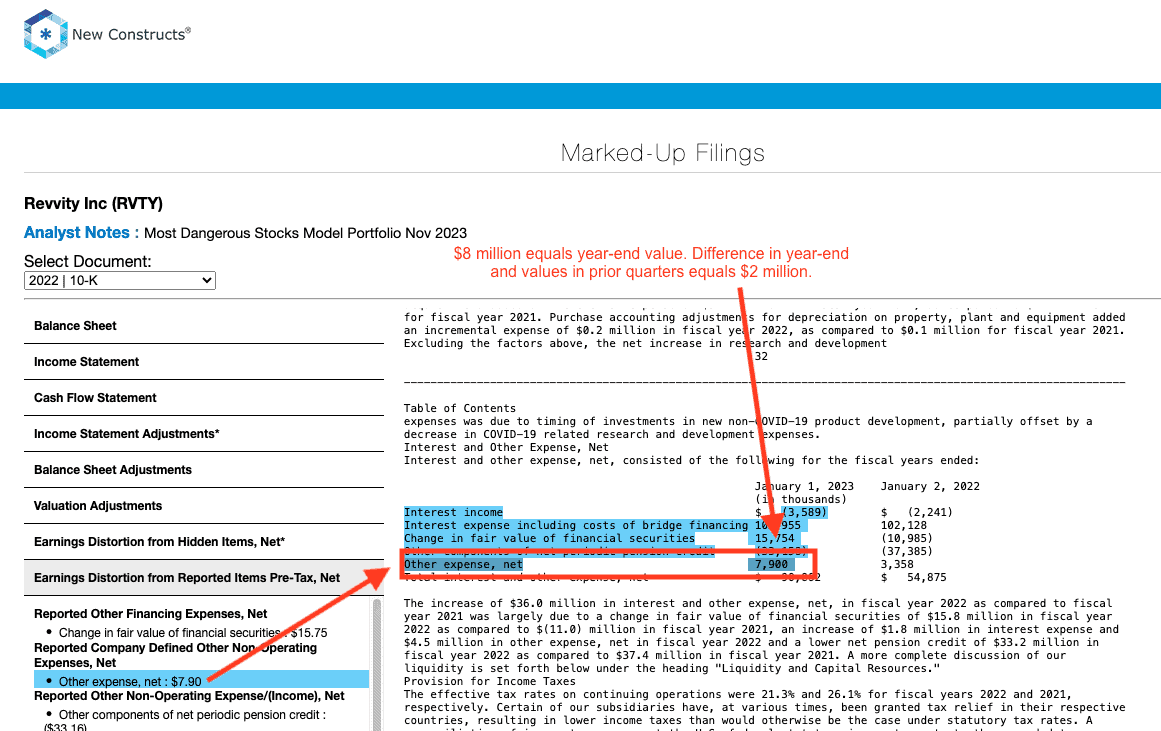
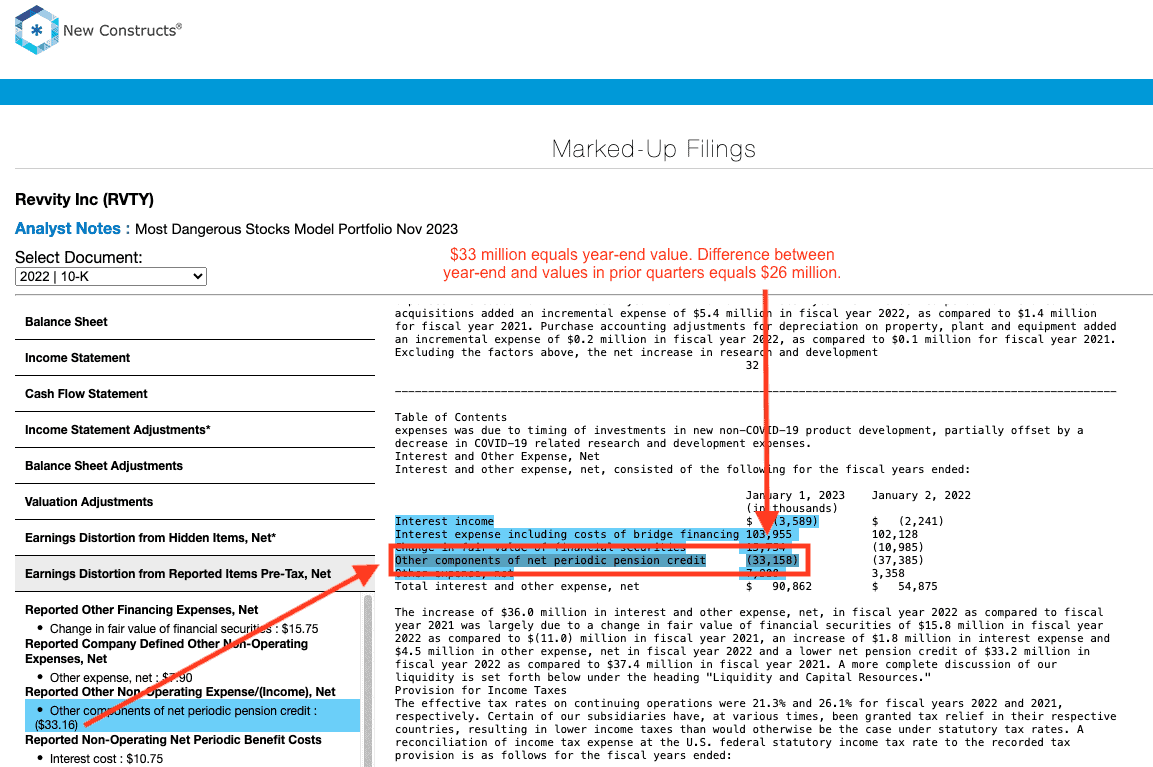
- $3 million in pension income in the TTM based on $3 million in pension income in the 2022 10-K
Reported Unusual Expenses Pre-Tax, Net = -$0.29/share, which equals -$35.9 million and is comprised of:
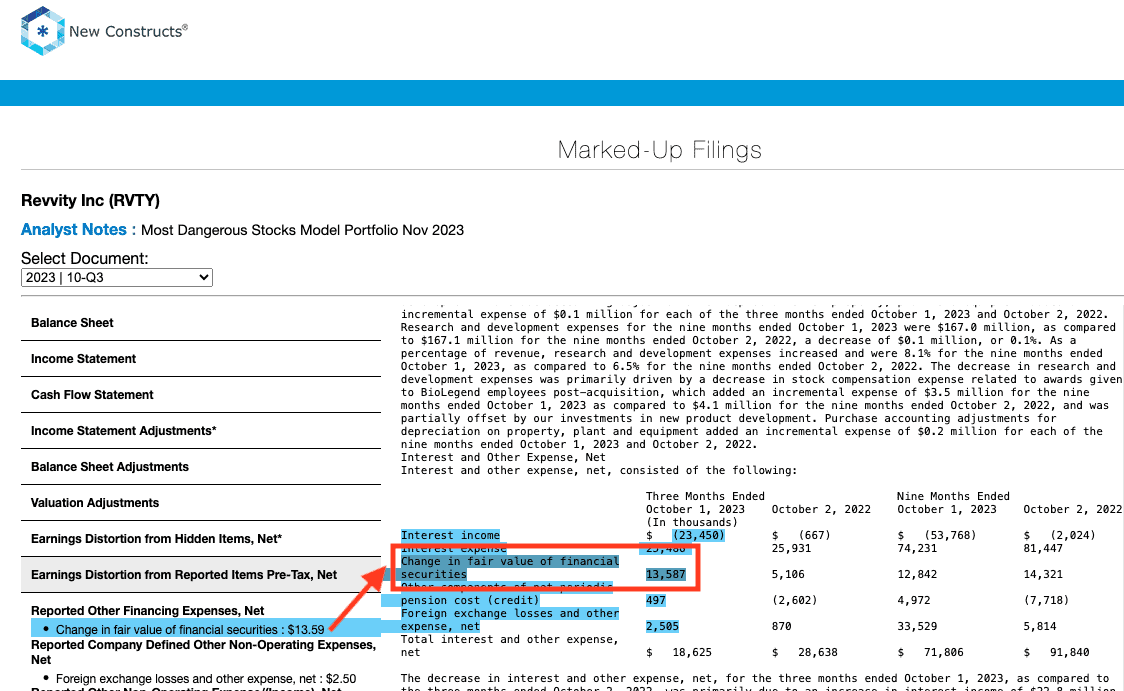
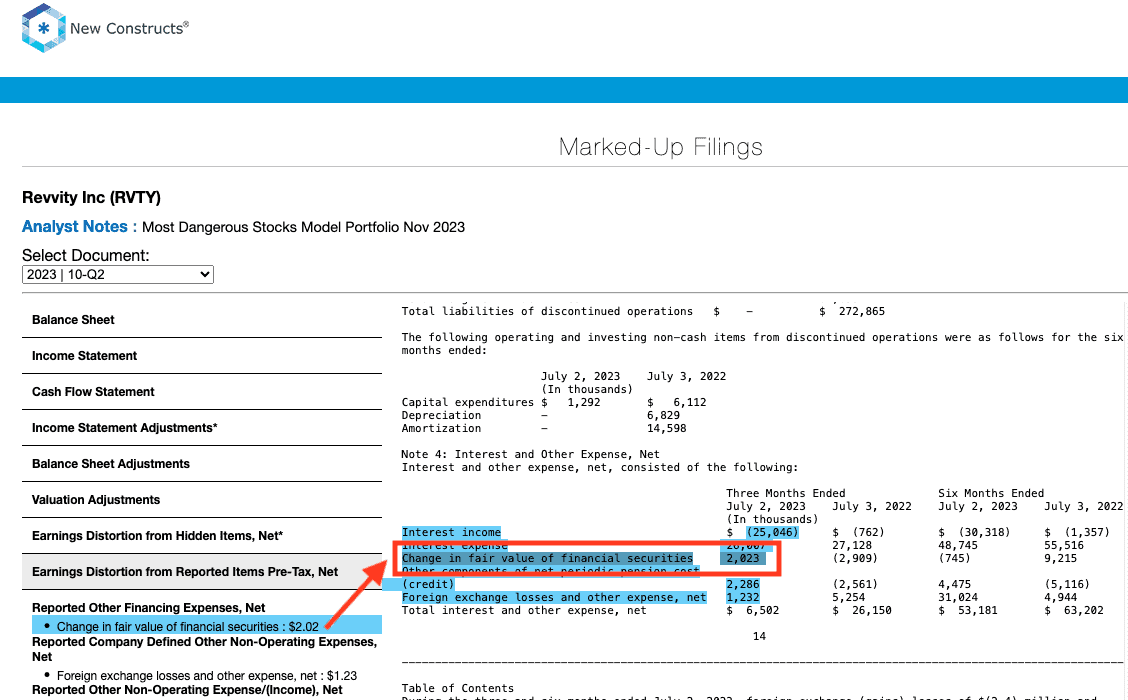
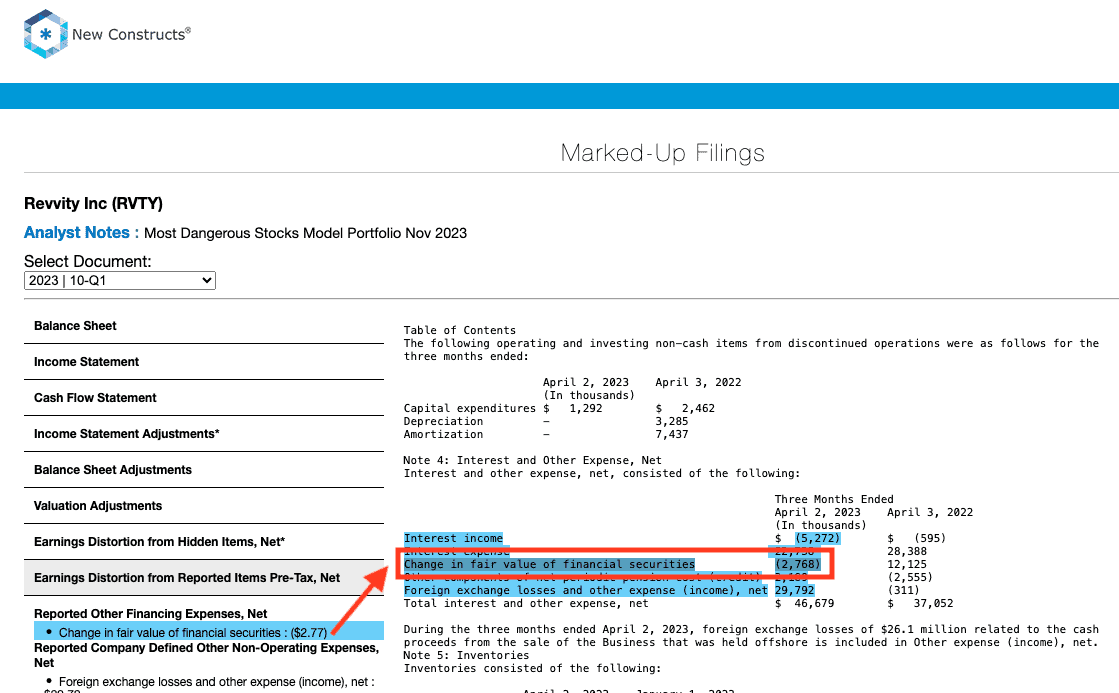
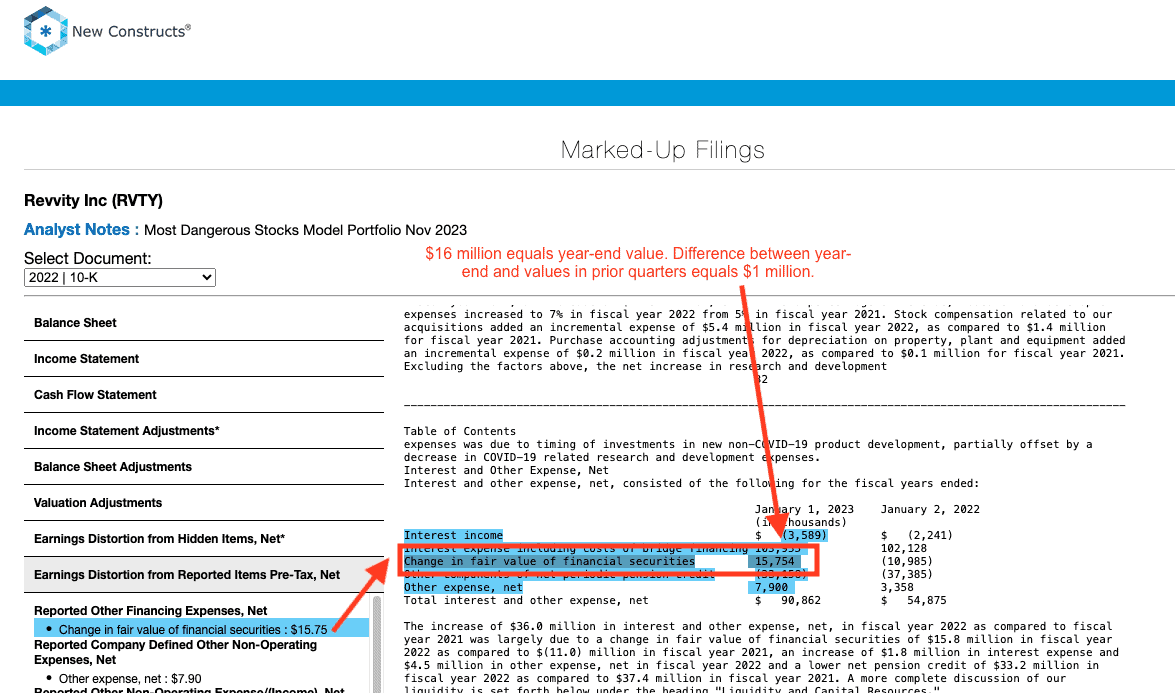
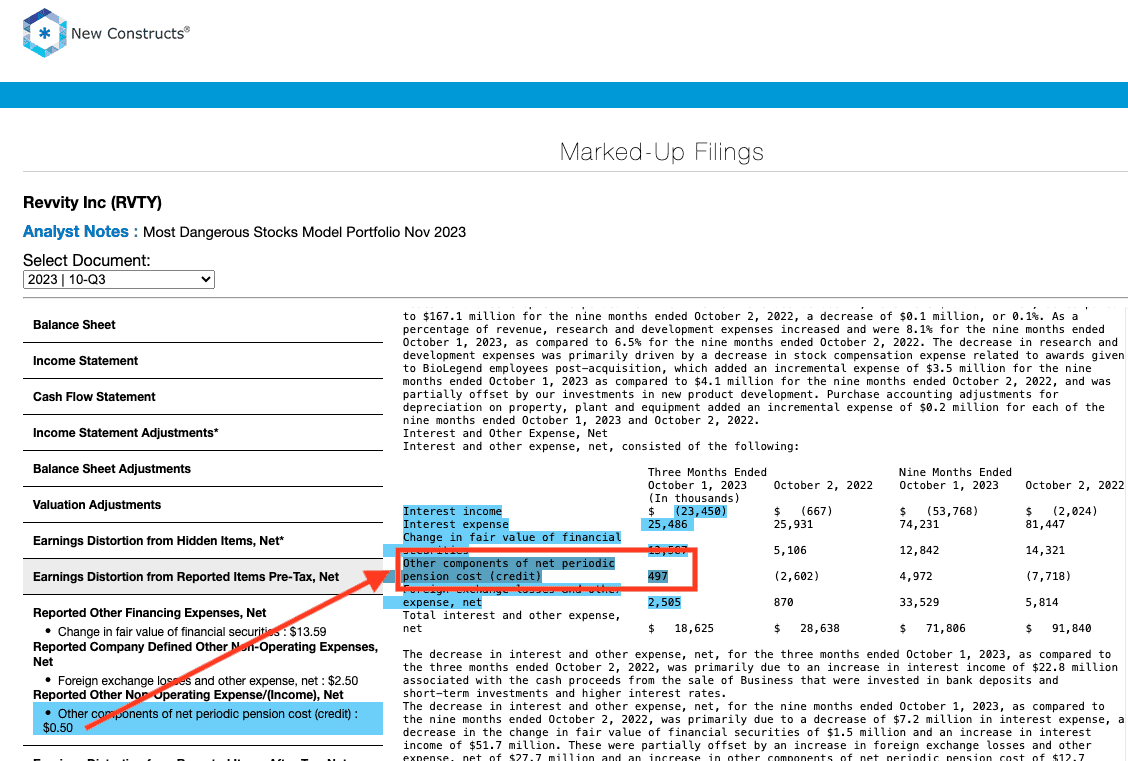
- -$14 million in the change in fair value of financial securities in the TTM period based on
- -$14 million in losses in 3Q23
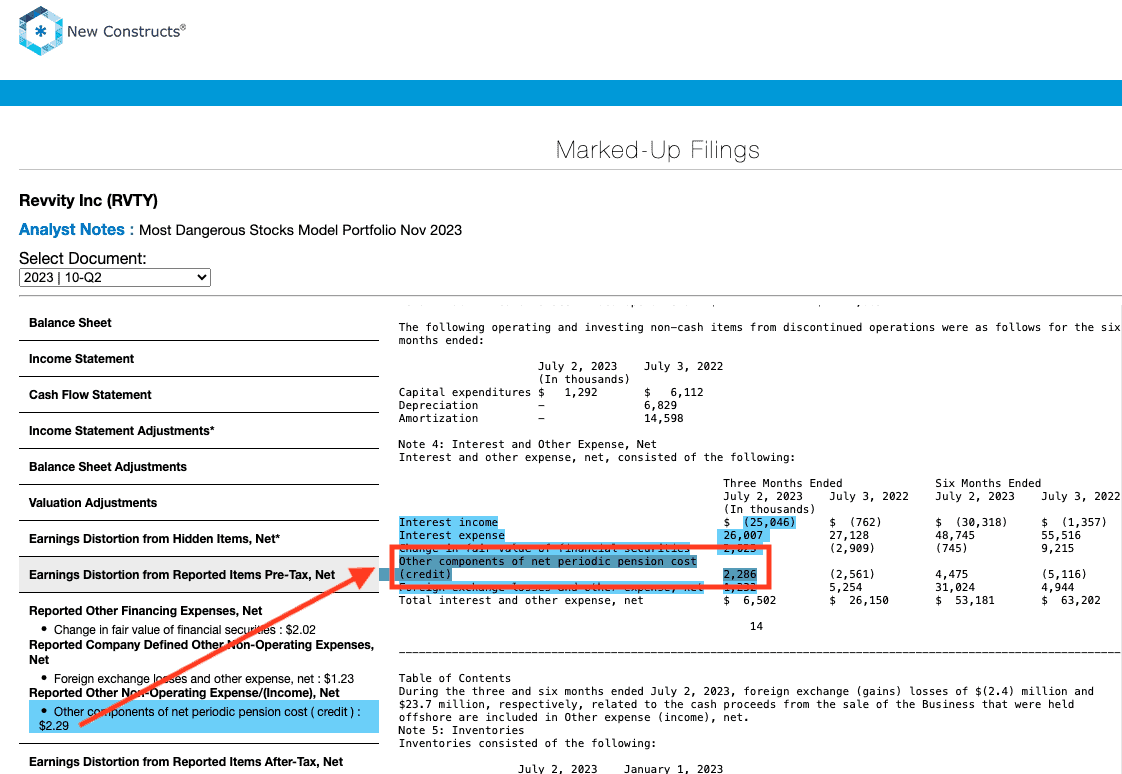
- -$2 million in losses in 2Q23
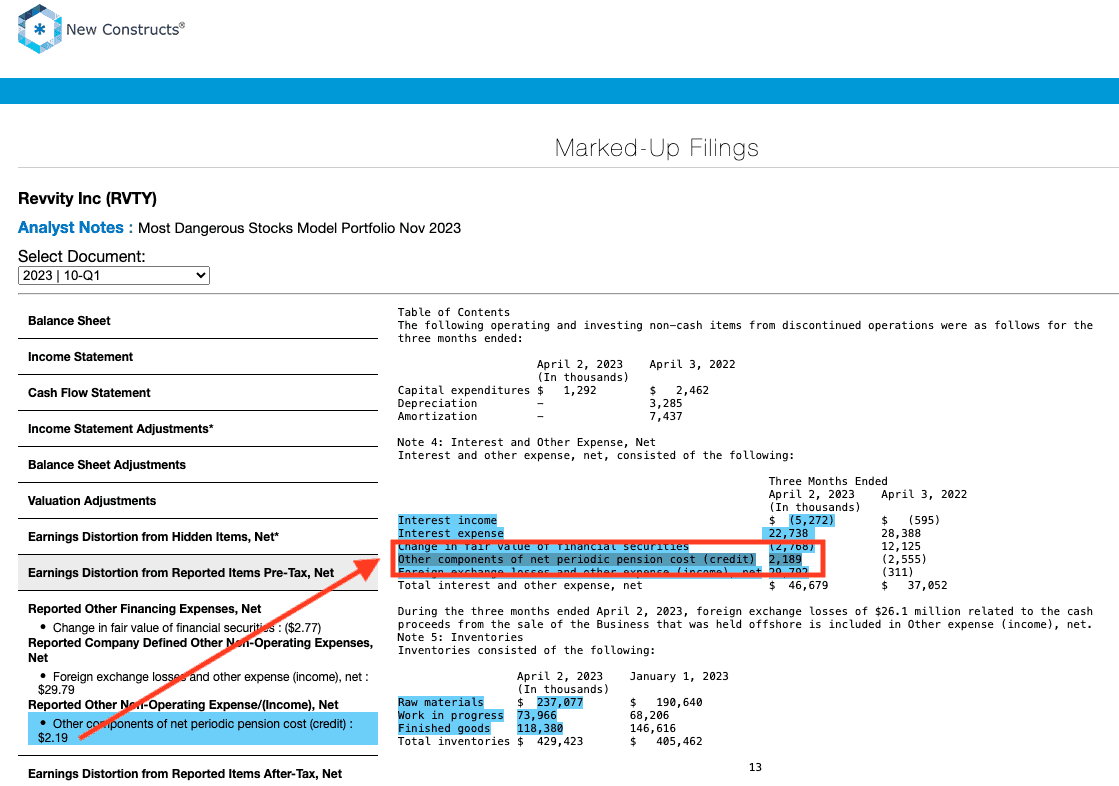
- $3 million in gains in 1Q23
- -$1 million in losses in 4Q22
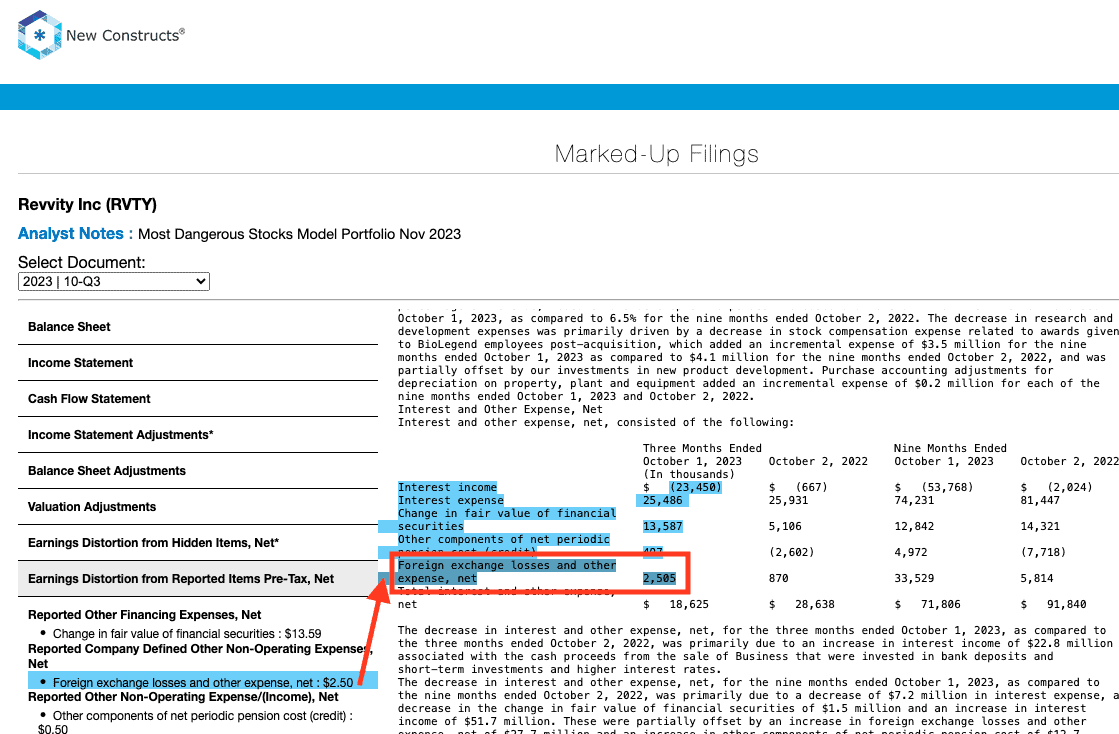
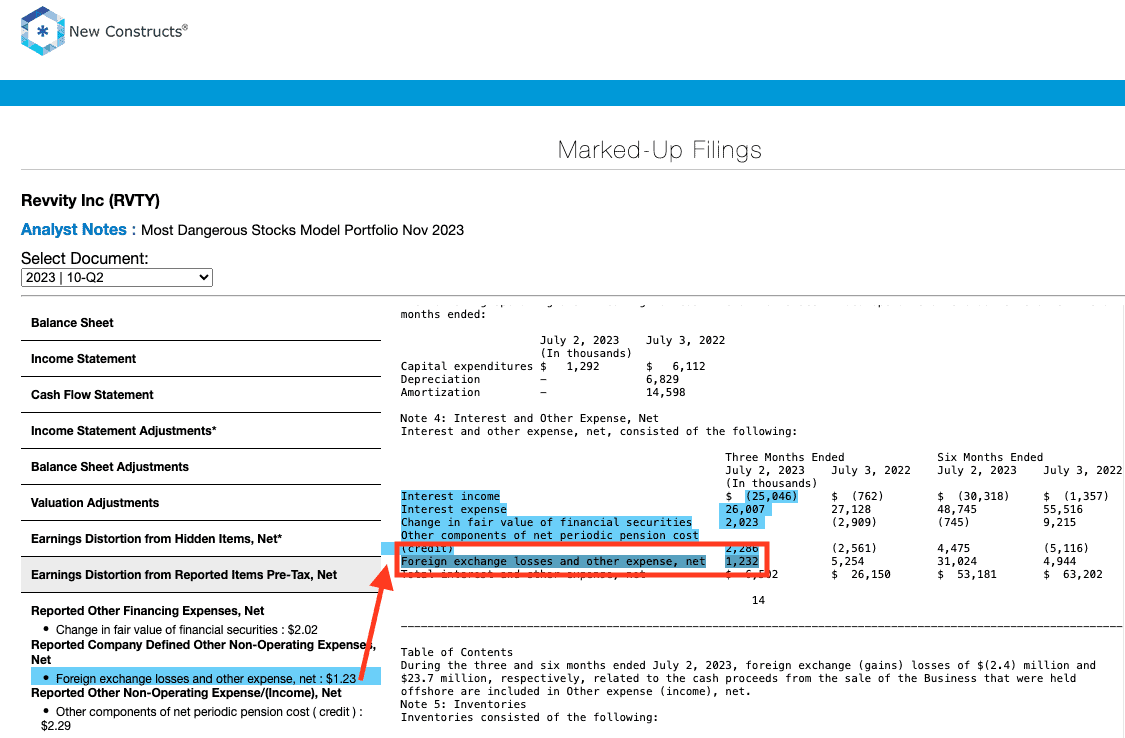
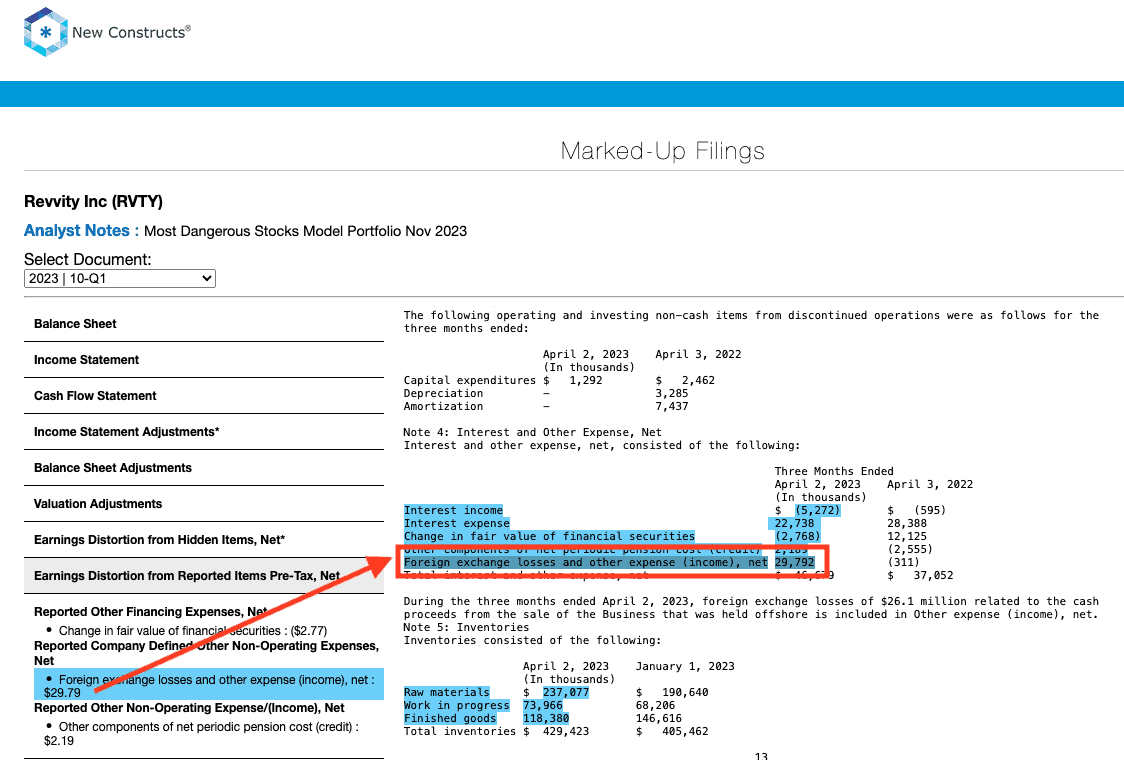
- -$36 million in foreign exchange losses and other expense in the TTM period based on
- -$3 million in 3Q23
- -$1 million in 2Q23
- -$30 million in 1Q23
- -$2 million in 4Q22
- $21 million in other components of net periodic pension benefit in the TTM period based on
- -$1 million cost in 3Q23
- -$2 million cost in 2Q23
- -$2 million cost in 1Q23
- $26 million benefit in 4Q22
- $28 million reversal of restructuring expenses disclosed in 2022 10-Qs but no longer broken out in the 2022 10-K
- $35 million contra adjustment for recurring pension costs. These recurring expenses are reported in non-recurring line items, so we add them back and exclude them from Earnings Distortion.
Tax Distortion = $0.17/per share, which equals $21 million
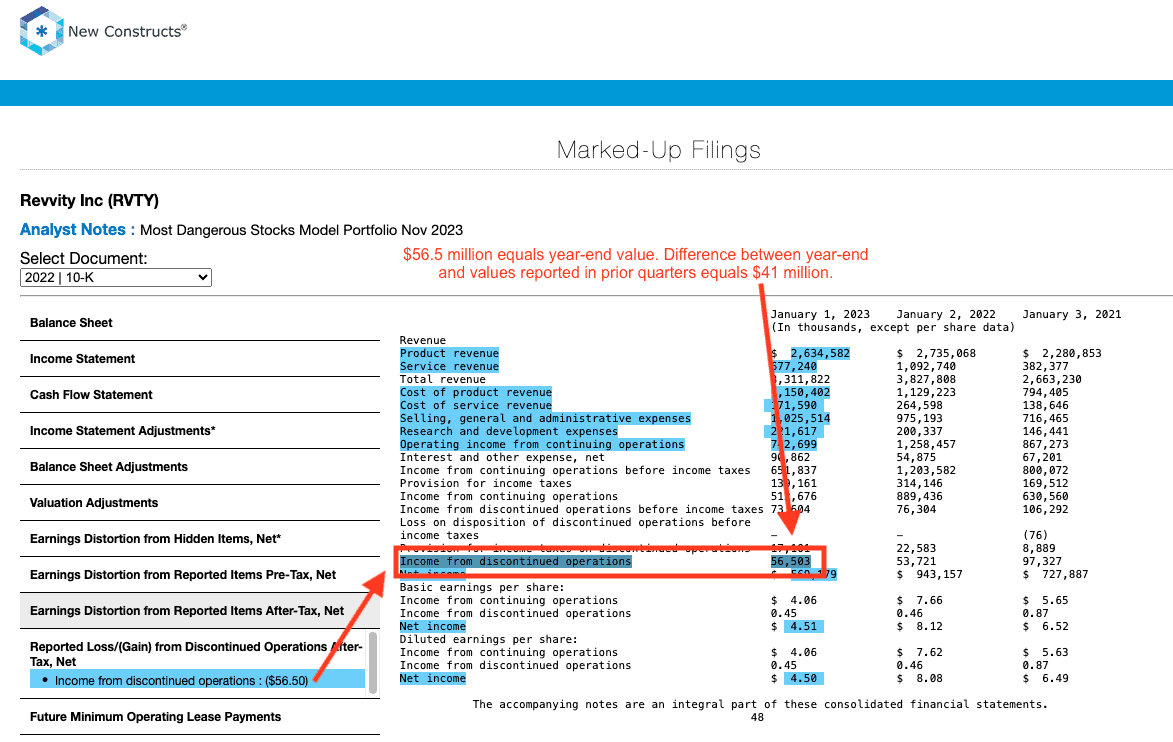
Reported Unusual Gains After-Tax, Net = $4.30/share, which equals $539 million and is comprised of:
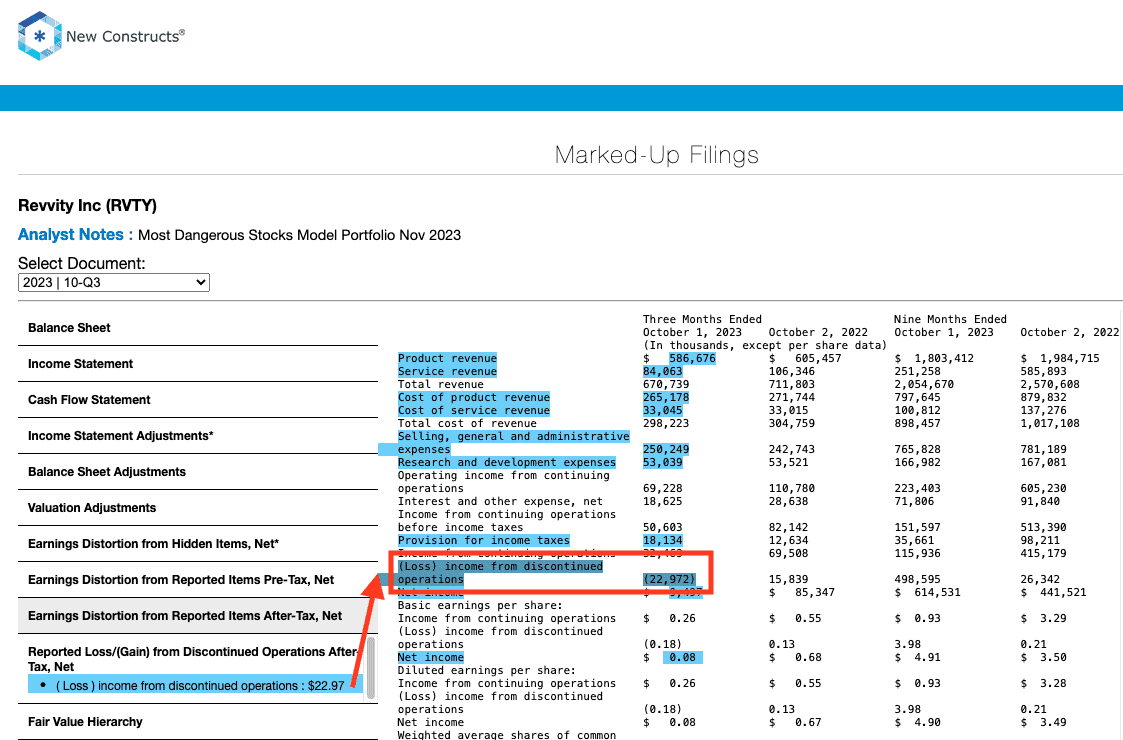
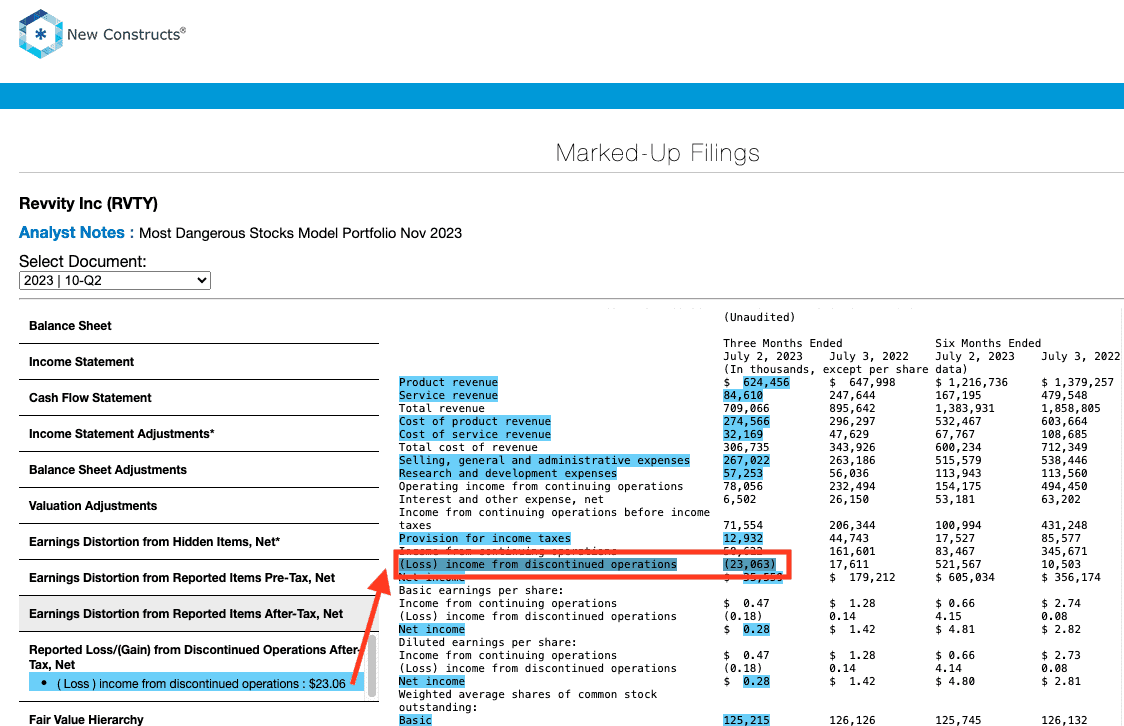
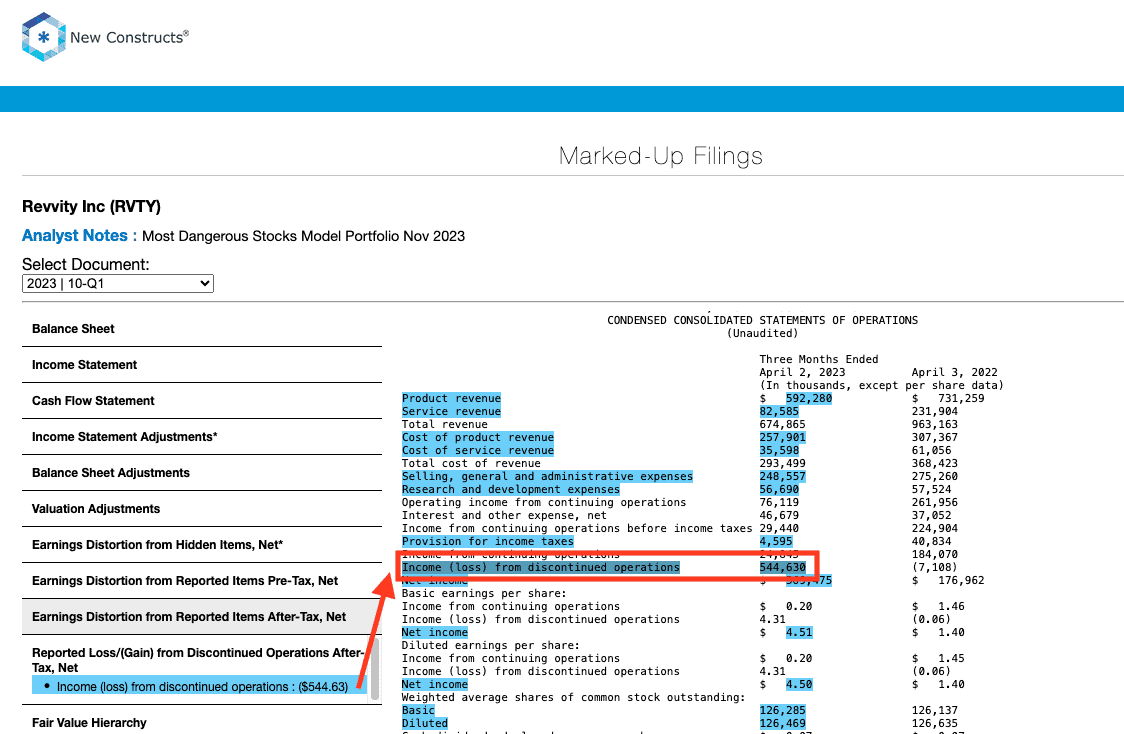
- $539 million in income from discontinued operations in the TTM period based on
- -$23 million in losses in 3Q23
- -$23 million in losses in 2Q23
- $545 million in income in 1Q23
- $41 million in income in 4Q22
Given that the majority of Earnings Distortion listed above is reported, unknowing investors may assume Street Earnings properly adjust for these items. However, given the $2.88/share Street Distortion in Revvity’s earnings, it’s clear that Core Earnings include a more comprehensive set of unusual items when calculating true profitability.
This article was originally published on December 4, 2023.
Disclosure: David Trainer, Kyle Guske II, Italo Mendonça, and Hakan Salt receive no compensation to write about any specific stock, style, or theme.
Questions on this report or others? Join our Society of Intelligent Investors and connect with us directly.
[1] The Journal of Financial Economics features the superiority of our Core Earnings in Core Earnings: New Data & Evidence.
[2] Our Core Earnings research is based on the latest audited financial data, which is the calendar 3Q23 10-Q in most cases. Price data as of 11/14/23. QoQ analysis is based on the change since last quarter’s report.
[3] Average overstated % is calculated as Street Distortion, which is the difference between Street Earnings and Core Earnings.