
Our report on Overstated Street Earnings in 2Q23 shows Street Earnings (based on Zacks Earnings) overstate profits for the majority of S&P 500 companies in 2Q23. However, there are nearly 140 S&P 500 companies with TTM 2Q23 Street Earnings that are lower than their true profits, i.e. Core Earnings[1],[2]. These companies are more profitable than investors realize and, in many cases, undervalued as well.
This report shows:
- the magnitude of understated Street Earnings in the S&P 500,
- why Street Earnings (and GAAP earnings) are flawed, and
- five S&P 500 companies with understated Street Earnings and Very Attractive Stock Ratings.
136 S&P 500 Companies Have Understated Street Earnings
For 136 companies in the S&P 500, or 27%, Street Earnings are lower than Core Earnings in the trailing-twelve-months (TTM) ended 2Q23. In the TTM ended 1Q23, Street Earnings were understated for 146 companies.
When Street Earnings are lower than Core Earnings, they are understated by an average of 28% per company, per Figure 1.
Figure 1: Street Earnings Understated by 28% on Average in TTM Through 2Q23[3]

Sources: New Constructs, LLC and company filings.
The 136 companies with understated Street Earnings represent 29% of the market cap of the S&P 500 as of 8/15/23, which is up from 27% in the TTM ended 1Q23.
Figure 2: Understated Street Earnings as % of Market Cap: 2012 through 8/15/23
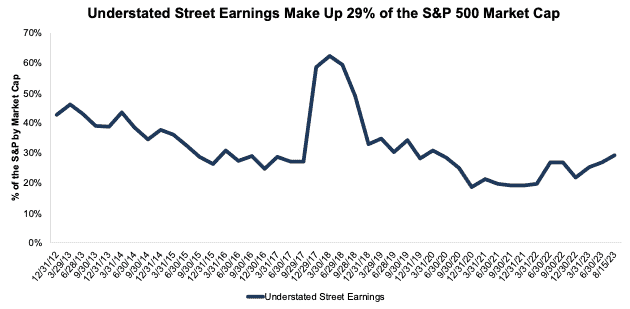
Sources: New Constructs, LLC and company filings.
For 47 companies, Street Earnings are overstated by more than 10% vs. Core Earnings. These 47 companies make up 11% of the market cap of the S&P 500 as of 8/15/23. See Figure 3.
Figure 3: Understated Street Earnings by 10% as % of Market Cap: 2012 through 8/15/23
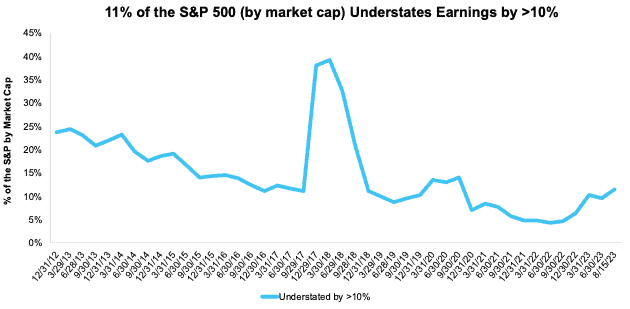
Sources: New Constructs, LLC and company filings.
The Five Most Understated Earnings in the S&P 500
Figure 4 shows five S&P 500 stocks with Very Attractive Stock Ratings and the most understated Street Earnings (based on Street Distortion as a % of Street Earnings per share) in the TTM ended 2Q23. “Street Distortion” equals the difference between Core and Street Earnings on a per share basis. Investors relying only on Street Earnings miss the true profitability of these businesses.
Figure 4: S&P 500 Companies with Most Understated Street Earnings: TTM 2Q23
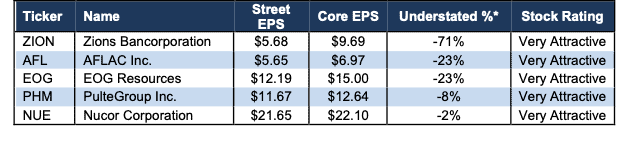
Sources: New Constructs, LLC and company filings.
*Measured as Street Distortion as a percent of Street EPS
In the section below, we detail the hidden and reported unusual items that distort GAAP Earnings for PulteGroup (PHM). All these unusual items are removed from Core Earnings.
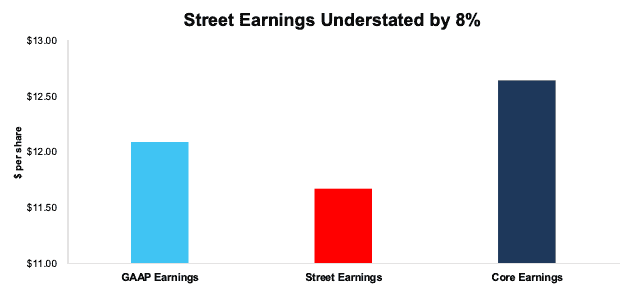
PulteGroup’s TTM 2Q23 Street Earnings Understated by $0.97/share
The difference between, or Street Distortion in, PulteGroup’s TTM 2Q23 Street Earnings ($11.67/share) and Core Earnings ($12.64/share) is $0.97/share, or 8% of Street Earnings.
PulteGroup’s TTM 2Q23 GAAP Earnings ($12.09/share) are $0.55/share lower than Core Earnings, which indicates that Street Earnings are even more understated and miss more of the unusual items that distort GAAP Earnings for PulteGroup. Our proprietary process for adjusting financial filings corrects these inaccuracies and reflects true profitability.
Figure 5: Comparing PulteGroup’s GAAP, Street, and Core Earnings: TTM 2Q23
Sources: New Constructs, LLC and company filings.
Below, we detail the differences between Core Earnings and GAAP Earnings so readers can audit our research. We would be happy to reconcile our Core Earnings with Street Earnings but cannot because we do not have the details on how analysts calculate their Street Earnings.
PulteGroup’s Earnings Distortion Score is Beat and its Stock Rating is Very Attractive, in part due to its positive economic earnings, return on invested capital (ROIC) of 17% and price-to-economic book value (PEBV) ratio of 0.6.
Figure 6 details the differences between PulteGroup’s Core Earnings and GAAP Earnings.
Figure 6: PulteGroup’s GAAP Earnings to Core Earnings Reconciliation: TTM 2Q23

Sources: New Constructs, LLC and company filings.
More details:
Total Earnings Distortion of -$0.55/share, which equals -$125 million, is comprised of the following:
Hidden Unusual Expenses, Net = -$0.19/per share, which equals -$44 million and is comprised of:
- -$140 million in capitalized interest in the TTM period based on
- -$31 million in 2Q23
- -$28 million in 1Q22
- -$40 million in 4Q22
- -$41 million in 3Q22
- $98 million in adjustments to previously recorded reserves in the TTM based on
- $65 million in 2Q23
- <$1 million in 1Q23
- $32 million in 4Q22 and 3Q22 combined based on $65 million reported in the 2022 10-K
Reported Unusual Expenses Pre-Tax, Net = -$0.24/per share, which equals -$54 million and is comprised of:
- -$63 million in write-offs of deposits and pre-acquisition costs in the TTM based on
- -$1 million in 2Q23
- -$6 million in 1Q23
- -$31 million in 4Q22
- -$24 million in 3Q22
- $9 million in miscellaneous income in the TTM based on
- $3 million in 2Q23
- $3 million in 1Q23
- $2 million in 4Q22
- $1 million in 3Q22
Tax Distortion = -$0.06/per share, which equals $13 million
Reported Unusual Expenses After-Tax, Net = -$0.06/per share, which equals -$14 million and is comprised of:
- -$14 million in undistributed earnings allocated to participating securities in the TTM based on
- -$2 million in 2Q23
- -$2 million in 1Q23
- -$5 million in 4Q22
- -$4 million in 3Q22
- -$0.7 million in earnings distributed to participating securities in the TTM based on
- -$0.1 million in 2Q23
- -$0.1 million in 1Q23
- -$0.2 million in 4Q22
- -$0.2 million in 3Q22
Street Earnings being even lower than GAAP Earnings for PulteGroup indicate that Street Earnings miss many of the unusual items in GAAP Earnings. The $0.97/share Street Distortion highlights that Core Earnings include a more comprehensive set of unusual items when calculating PulteGroup’s true profitability.
This article was originally published on August 29, 2023.
Disclosure: David Trainer, Kyle Guske II, Italo Mendonça, and Hakan Salt receive no compensation to write about any specific stock, style, or theme.
Questions on this report or others? Join our Society of Intelligent Investors and connect with us directly.
[1] The Journal of Financial Economics features the superiority of our Core Earnings in Core Earnings: New Data & Evidence.
[2] Our Core Earnings research is based on the latest audited financial data, which is the calendar 2Q23 10-Q in most cases. Price data as of 8/15/23.
[3] Average understated % is calculated as Street Distortion, which is the difference between Street Earnings and Core Earnings.